|

Spotify Technology S.A. (SPOT) Elliott Wave technical analysis [Video]

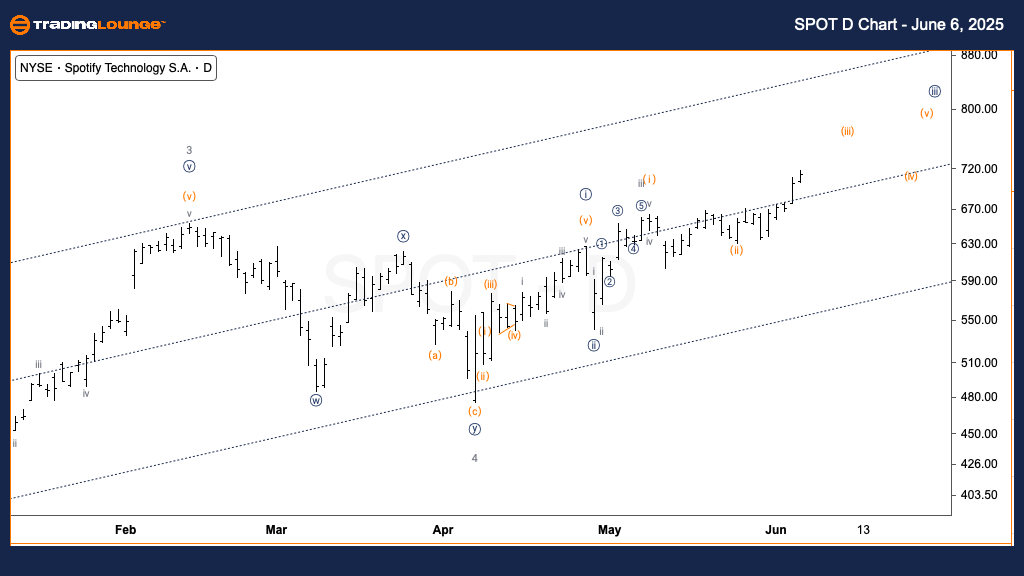
Spotify Technology S.A. (SPOT) – Daily chart

Technical analysis based on Elliott Wave theory

Function: Trend.

Mode: Impulsive.

Structure: Motive.

Position: Wave (iii) of {iii}.

Direction: Upside in wave (iii).

Details: This represents the most bullish scenario for SPOT, forecasting potential movement toward the $800 level as wave (iii) extends.

Spotify is demonstrating a strong bullish structure on the daily chart, situated in wave (iii) of a larger wave {iii}. This formation suggests increasing momentum and strong upside potential, with $800 acting as the expected price target under this scenario. The chart supports the impulse structure, reinforcing upward continuation in the near term.

Chart

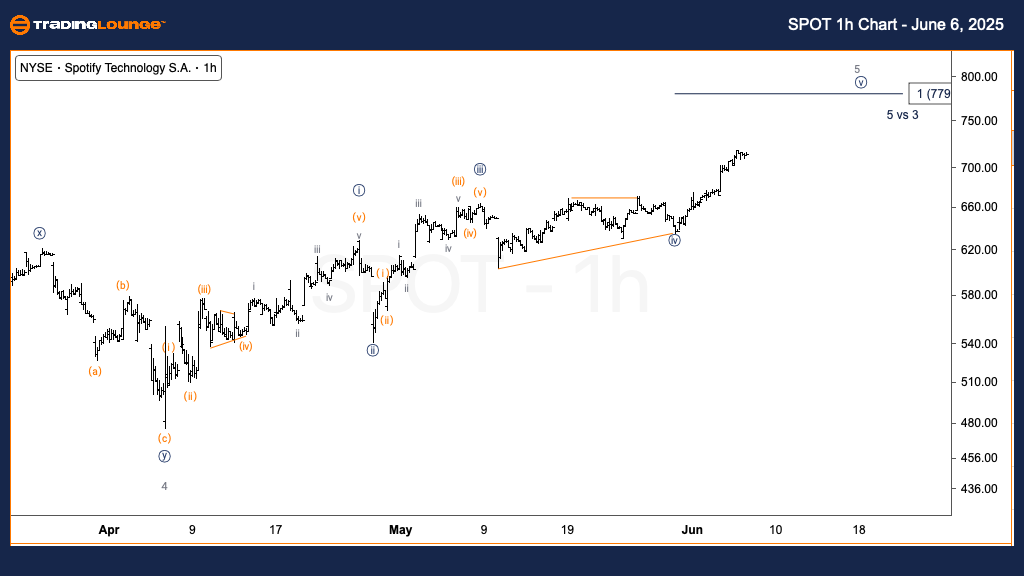
Spotify Technology S.A. (SPOT) – One-hour chart

Function: Trend.

Mode: Impulsive.

Structure: Motive.

Position: Wave {v} of 5.

Direction: Upside in wave {v}.

Details: This more conservative outlook assumes wave {v} is now developing, with upside limited to $779, considering wave {iii} is shorter than wave {i}.

In the hourly timeframe, SPOT is moving within wave {v} of 5. With wave {iii} being shorter than wave {i}, upside is expected to cap at approximately $779, aligning with typical Elliott Wave guidelines. This count suggests a near-term high may soon form, followed by a likely corrective phase.

Chart

Spotify Technology S.A. (SPOT) Elliott Wave technical analysis [Video]

Author

Peter Mathers

Peter Mathers

TradingLounge

Peter Mathers started actively trading in 1982. He began his career at Hoei and Shoin, a Japanese futures trading company.

More from Peter Mathers
Share:

Markets move fast. We move first.

Orange Juice Newsletter brings you expert driven insights - not headlines. Every day on your inbox.

By subscribing you agree to our Terms and conditions.

Editor's Picks

EUR/USD: Bulls pray for a dovish Fed

EUR/USD has finally taken a breather after a pretty energetic climb. The pair broke above 1.1680 in the second half of the week, reaching its highest levels in around two months before running into some selling pressure. Even so, it has gained almost two cents from the late-November dip just below 1.1500 the figure.

GBP/USD trims gains, recedes toward 1.3320

GBP/USD is struggling to keep its daily advance, coming under fresh pressure and retreating to the 1.3320 zone following a mild bullish attempt in the Greenback. Even though US consumer sentiment surprised to the upside, the US Dollar isn’t getting much love, as traders are far more interested in what the Fed will say next week.

Gold: Bullish momentum fades despite broad USD weakness

After rising more than 3.5% in the previous week, Gold has entered a consolidation phase and fluctuated at around $4,200. The Federal Reserve’s interest rate decision and revised Summary of Economic Projections, also known as the dot plot, could trigger the next directional move in XAU/USD. 

Week ahead: Rate cut or market shock? The Fed decides

Fed rate cut widely expected; dot plot and overall meeting rhetoric also matter. Risk appetite is supported by Fed rate cut expectations; cryptos show signs of life. RBA, BoC and SNB also meet; chances of surprises are relatively low. Dollar weakness could linger; both the aussie and the yen best positioned to gain further. Gold and oil eye Ukraine-Russia developments; a peace deal remains elusive.

Week ahead – Rate cut or market shock? The Fed decides

Fed rate cut widely expected; dot plot and overall meeting rhetoric also matter. Risk appetite is supported by Fed rate cut expectations; cryptos show signs of life. RBA, BoC and SNB also meet; chances of surprises are relatively low.

Ripple faces persistent bear risks, shrugging off ETF inflows

Ripple is extending its decline for the second consecutive day, trading at $2.06 at the time of writing on Friday. Sentiment surrounding the cross-border remittance token continues to lag despite steady inflows into XRP spot ETFs.