SPDR S&P 500 ETF Trust (SPY) Stock Price and Forecast: SPY stock technical outlook
- SPY set for strong gains on Tuesday as Russia, Ukraine fears ease.
- Could a rally materialize as interest rate hikes are now priced in?
- SPY is still rangebound between key levels $428 and $458.

US stocks are set for a solid opening as geopolitical tensions ease and risk assets begin to trade more accommodatively. This should see beaten down names outperform so look to retail interest, meme stocks as well as tech names. Chinese tech could see a strong bounce if risk-off remains. But headlines yesterday were constant on the Russian Ukraine situation so that should keep volatility elevated.
SPY stock news
Gold is down over $20, Oil is lower by 2% and the dollar is lower against all major currencies. This would be indicative of risk on and look to high beta stocks and sectors to outperform. If geopolitical conditions can remain calm we may have set up for a strong contra rally. Investor positioning is skewed to the downside. Nearly seven rate hikes are now priced in from the Fed. Witness the PPI data just out as I write. Again shockingly high but little reaction from the equity indices so far. The Nasdaq (QQQ) is barely unchanged. This may not change the longer-term sentiment with value likely to remain favoured versus growth and tech but short-term spikes and rallies are normal when sentiment and positioning become slightly too stretched. The last financial conditions index from CNN shows we're near max fear and the last AAII sentiment showed an unusually high bearish sentiment.
SPY stock forecast
For this bounce to play out we need to avoid the recent late session sell off. In other words, hold the gains we are likely to open with today. Hold above $428 and preferably any test lower should fail in the $430's. Breaking Fridays high at $451 would be the first target. That will then set up some few days of gains and another test at $458.
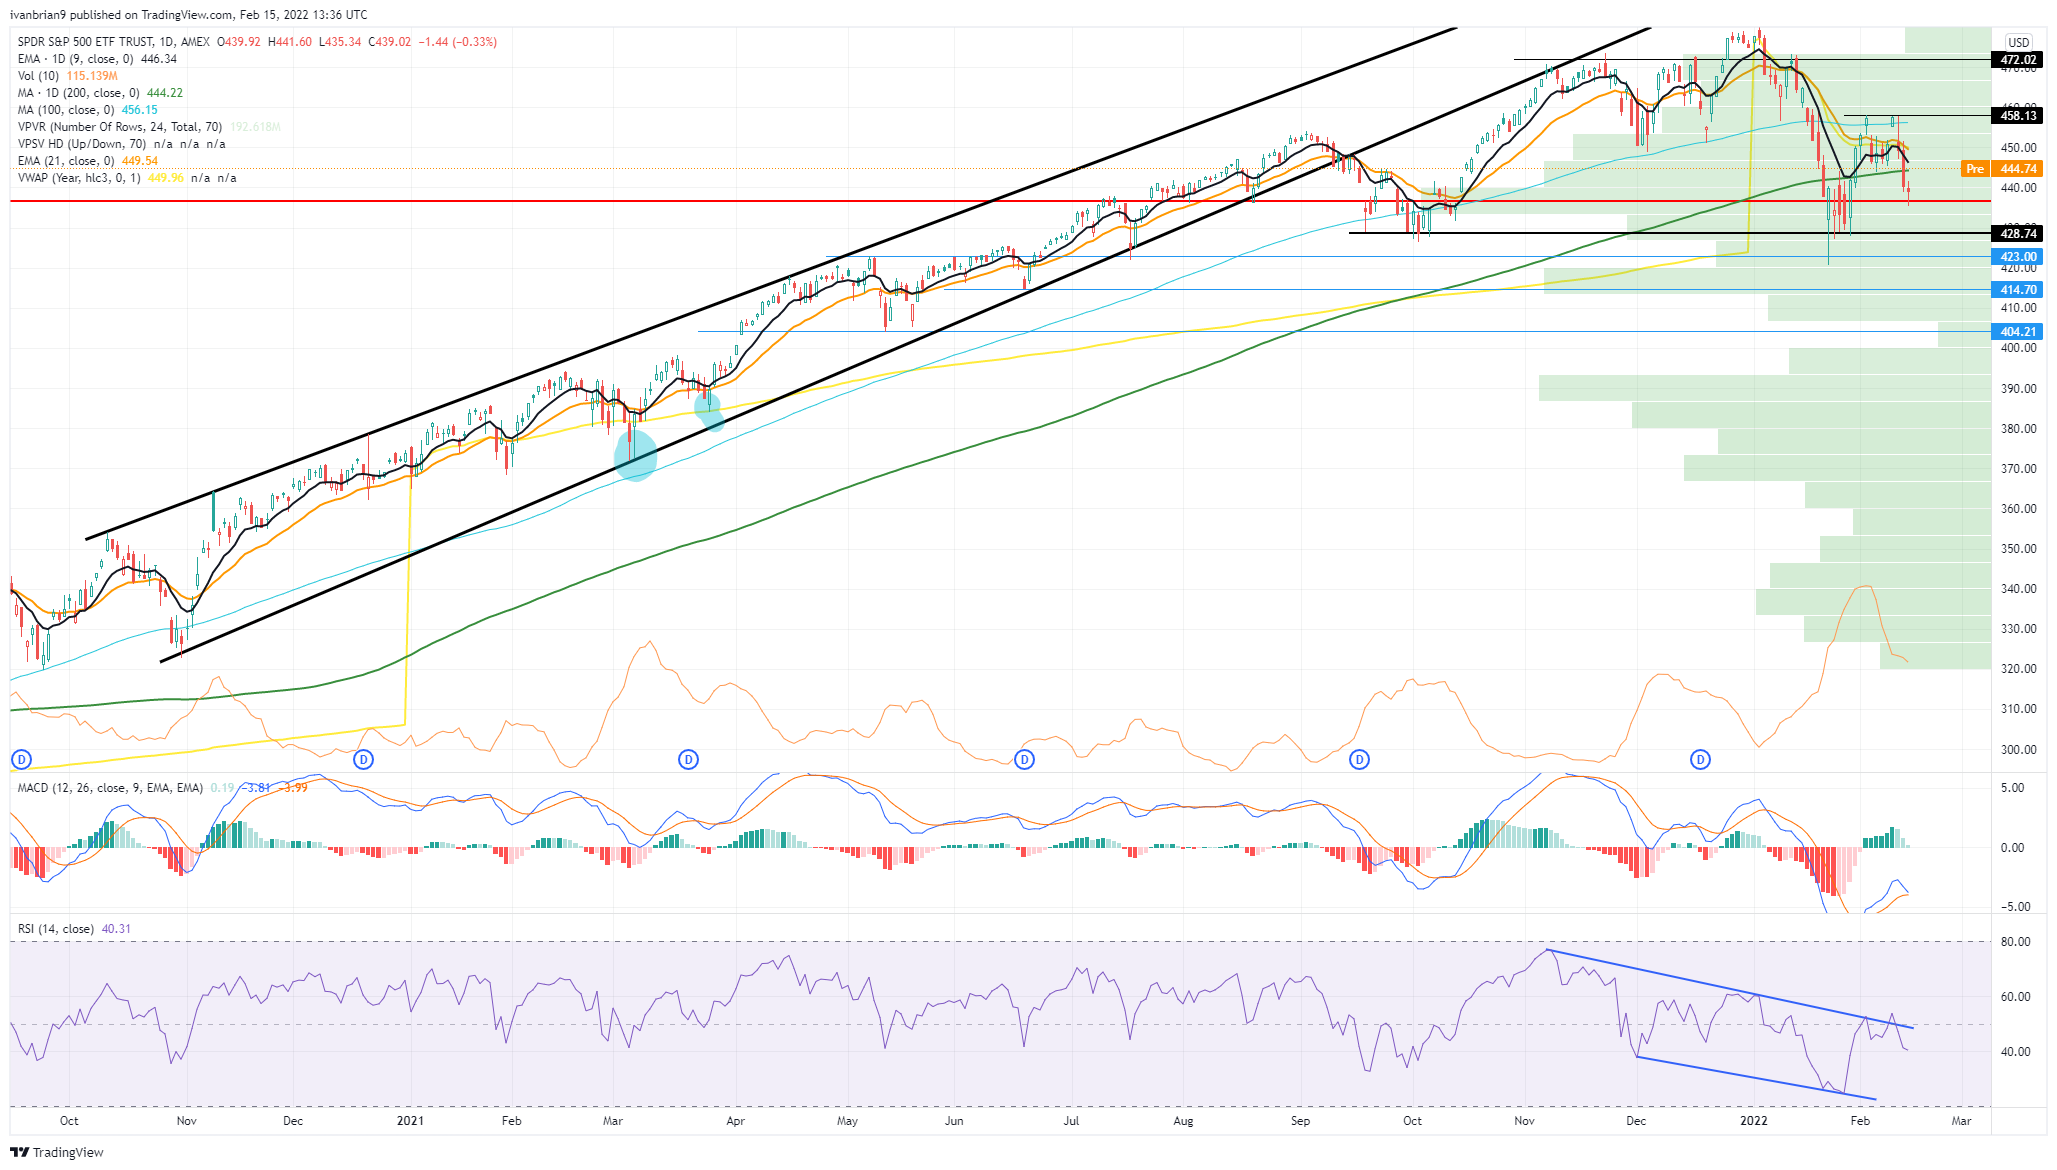
SPY stock chart, daily
The 15-minute chart gives us some more short-term swing trading info. Volume is high around $450 for February. It has basically been the equilibrium point for February. We gapped quickly from $450 to $440 and printed a lot of volume there. So there is a volume gap between that this geopolitical calming can take advantage of. We remain in the chop zone, $428 and $458 are the pivots.
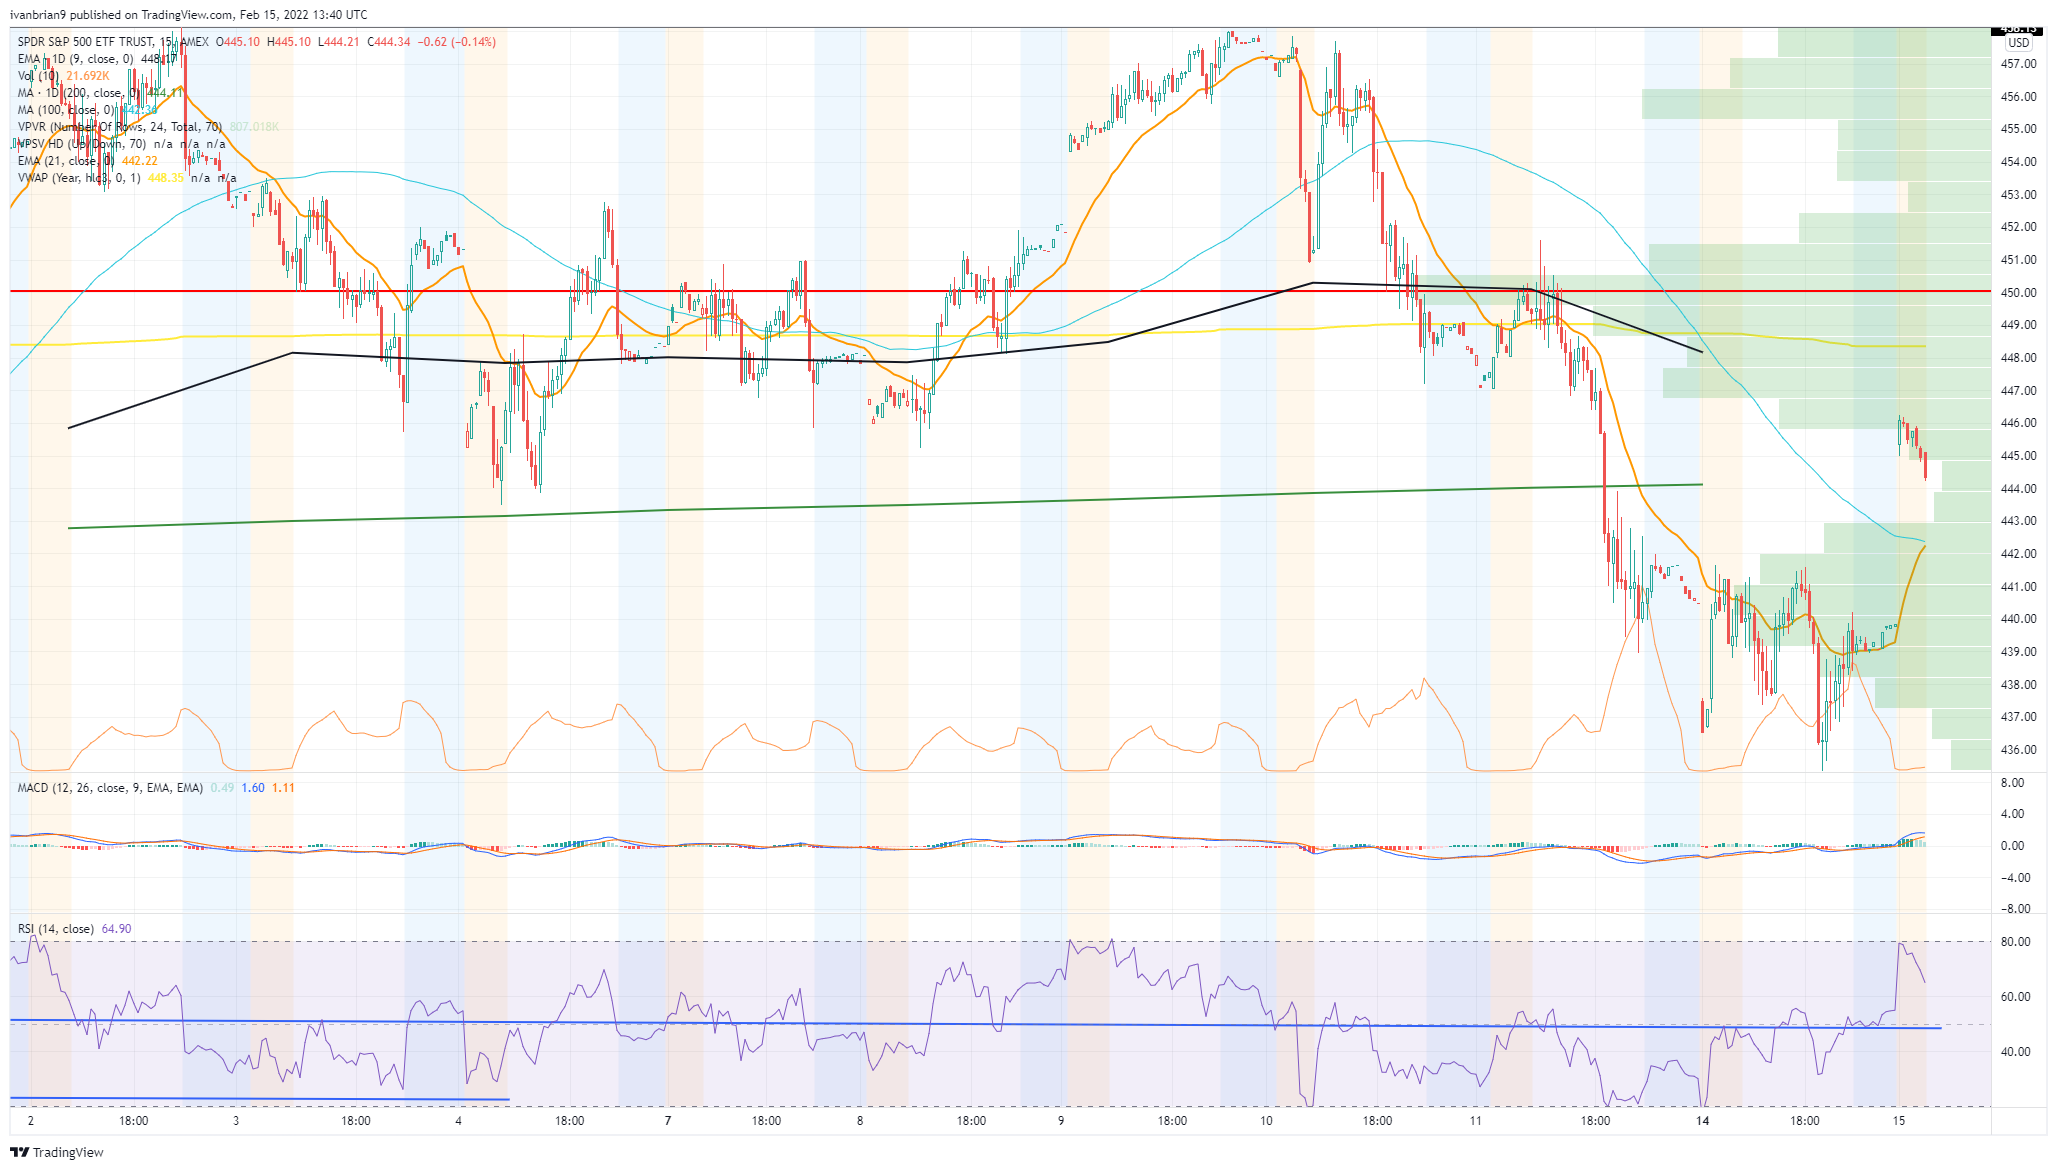
SPY stock chart, 15 minute
Premium
You have reached your limit of 3 free articles for this month.
Start your subscription and get access to all our original articles.
Author

Ivan Brian
FXStreet
Ivan Brian started his career with AIB Bank in corporate finance and then worked for seven years at Baxter. He started as a macro analyst before becoming Head of Research and then CFO.


