SPDR S&P 500 ETF Trust (SPY) Forecast: We are teetering on the brink
- S&P 500 falls again as the whipsaw continues.
- SPY falls 2% and Nasdaq falls nearly 3%.
- Nike adds to woes afterhours as margins fall.

Equity markets remain at the precipice of a technical collapse, which we examine in the weekly long-term chart below. The overall picture remains one of nervousness ahead of the upcoming Q3 earnings season, not helped of course by Nike afterhours.
SPY news
First, back to Thursday's action. We saw a turnaround on Thursday, but not a turnaround many had been hoping for. Yields moved higher, Fed speakers remained hawkish, and so equities took fright. In truth, the supposed pivot from the Bank of England that led to Wednesday's rally was not cause for celebration. The UK narrowly avoided a Lehman-style moment in its UK pensions industry. This was not a cause for bullishness then.
The penny dropped on Thursday, and investors dumped stocks. Apple was a leader, but a leader lower, as Bloomberg reported on it asking suppliers not to increase production. Meta Platforms (META) is out with a hiring freeze, and Nike then came out afterhours and said the dollar was a huge headwind ($4 billion in 2023) and that margins and inventories were a problem.
SPY forecast
Plenty of bearishness, but that makes the contrarian in me naturally uncomfortable. For starters, this is the end of the quarter, and we get some strange moves around the quarter end. Sentiment is also terrible with everyone max bearish. The CNN Fear and Greed Index is near max fear and positioning overly low, so we do have some conditions to see a dead cat bounce. We also have a month to go until Q3 earnings season, and October is historically a positive month. Now take a look at the long-term chart as it is very worrying. We are right on key support from the June low and now also the 200-week moving average. A break would see the target being the pre-pandemic high of around 3,400.
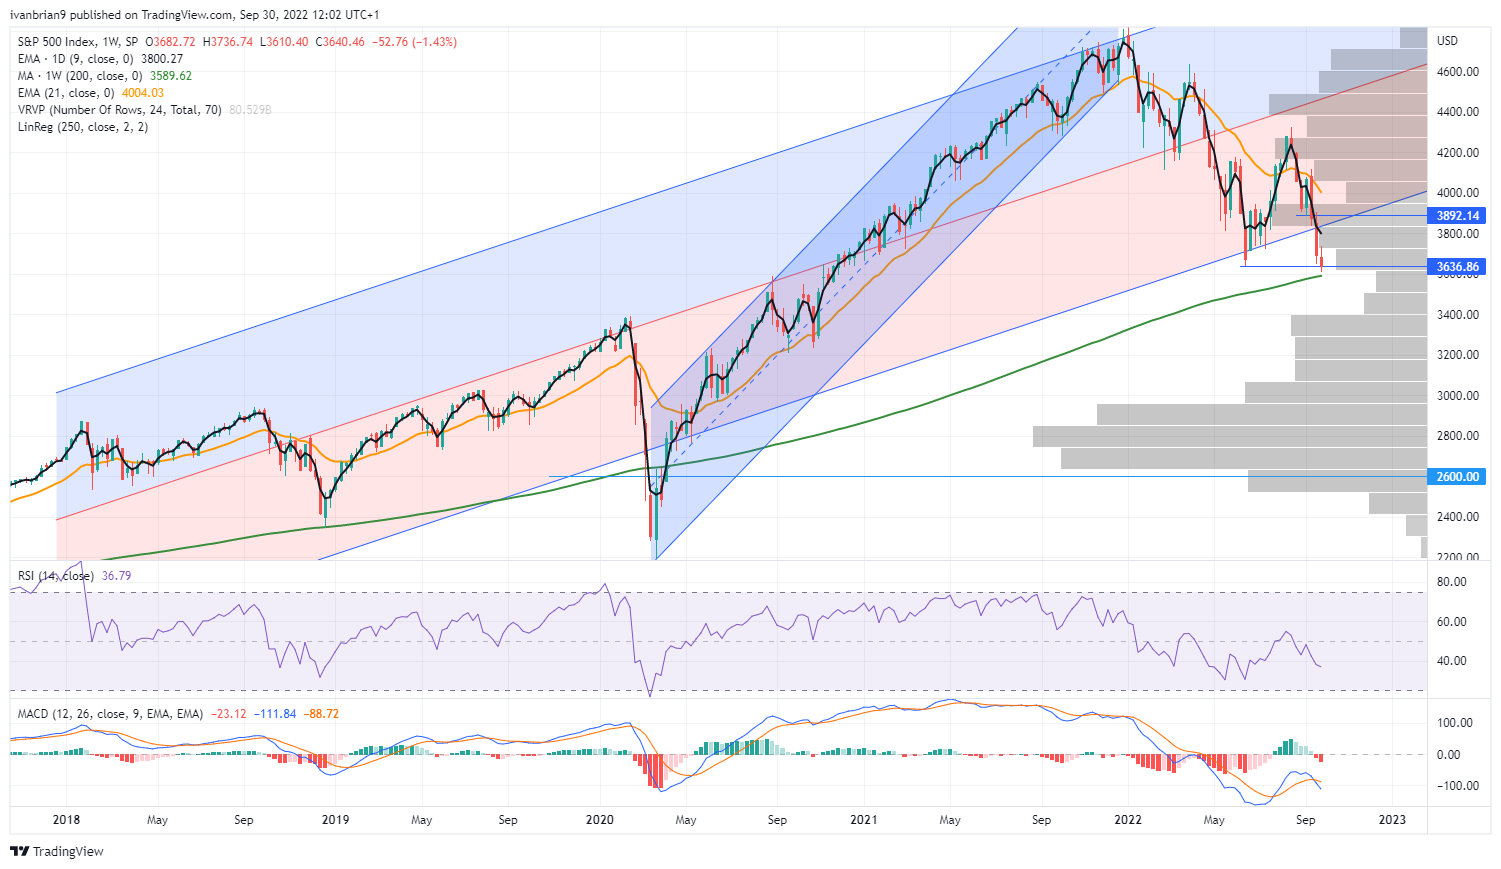
SPX weekly
For those of you looking at the SPY, the levels are $362 with a vacuum to $352 and the pre-pandemic high at $339.
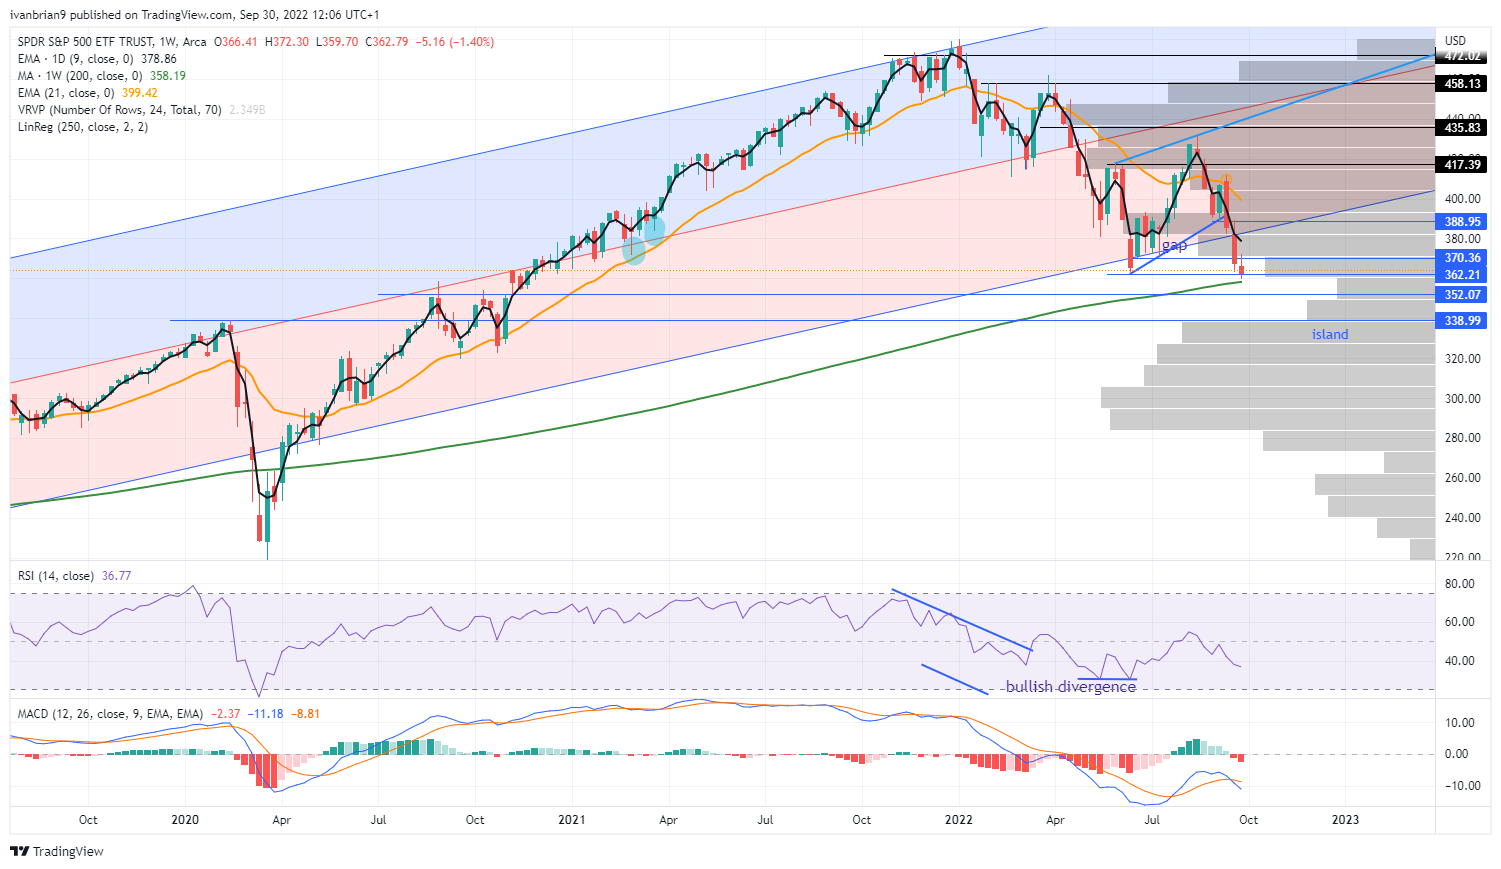
SPY weekly
On the daily chart, $373 is the pivot for a rally. A break could see a move to $388 pretty quickly based on such negativity and sentiment – a short squeeze essentially. The equivalent level in the SPX is 3,750.
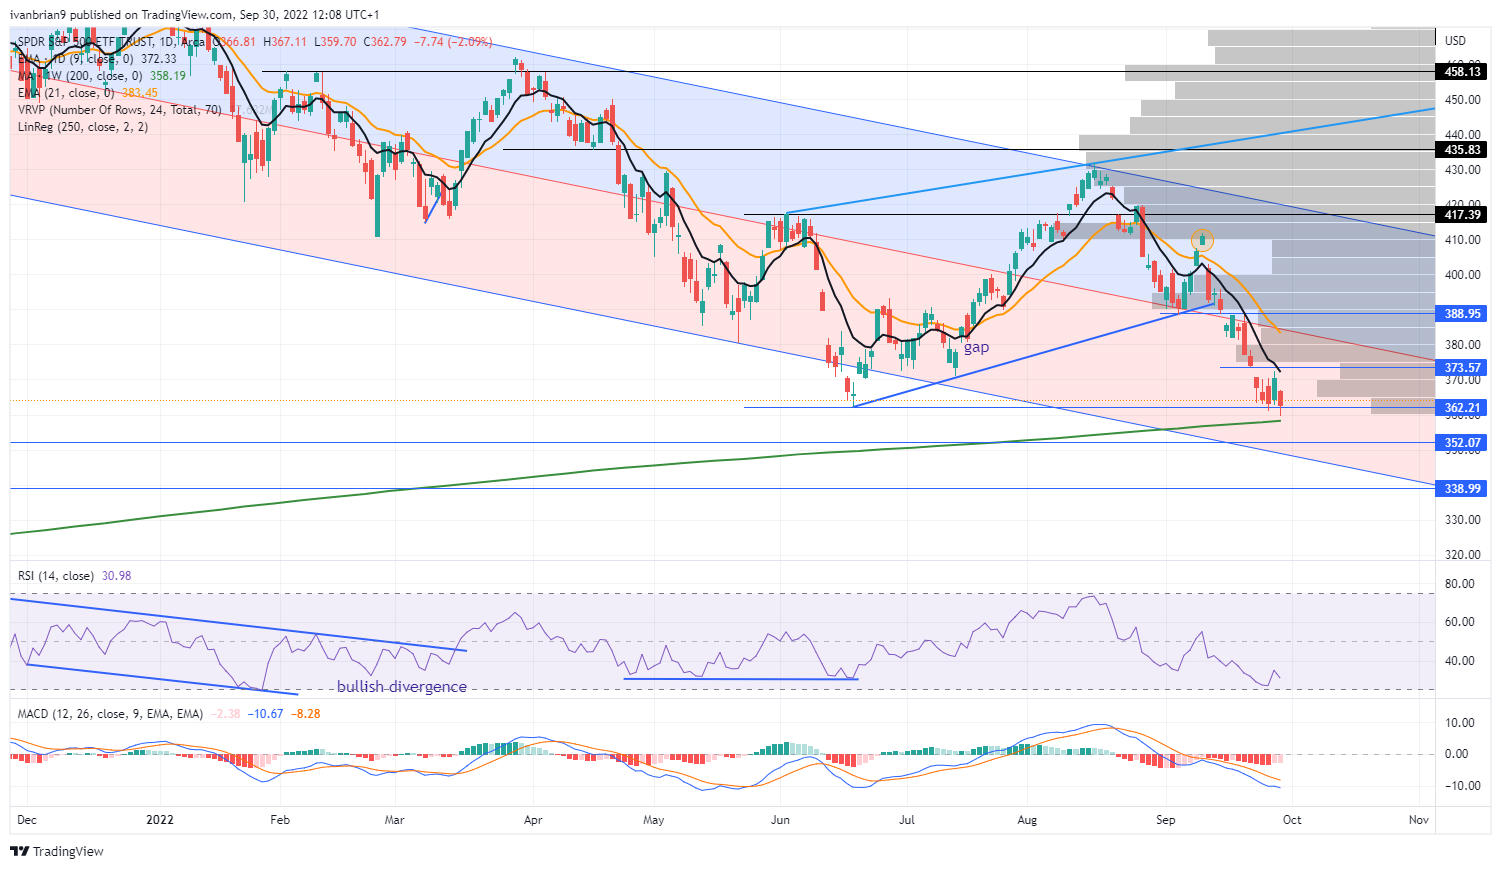
SPY daily
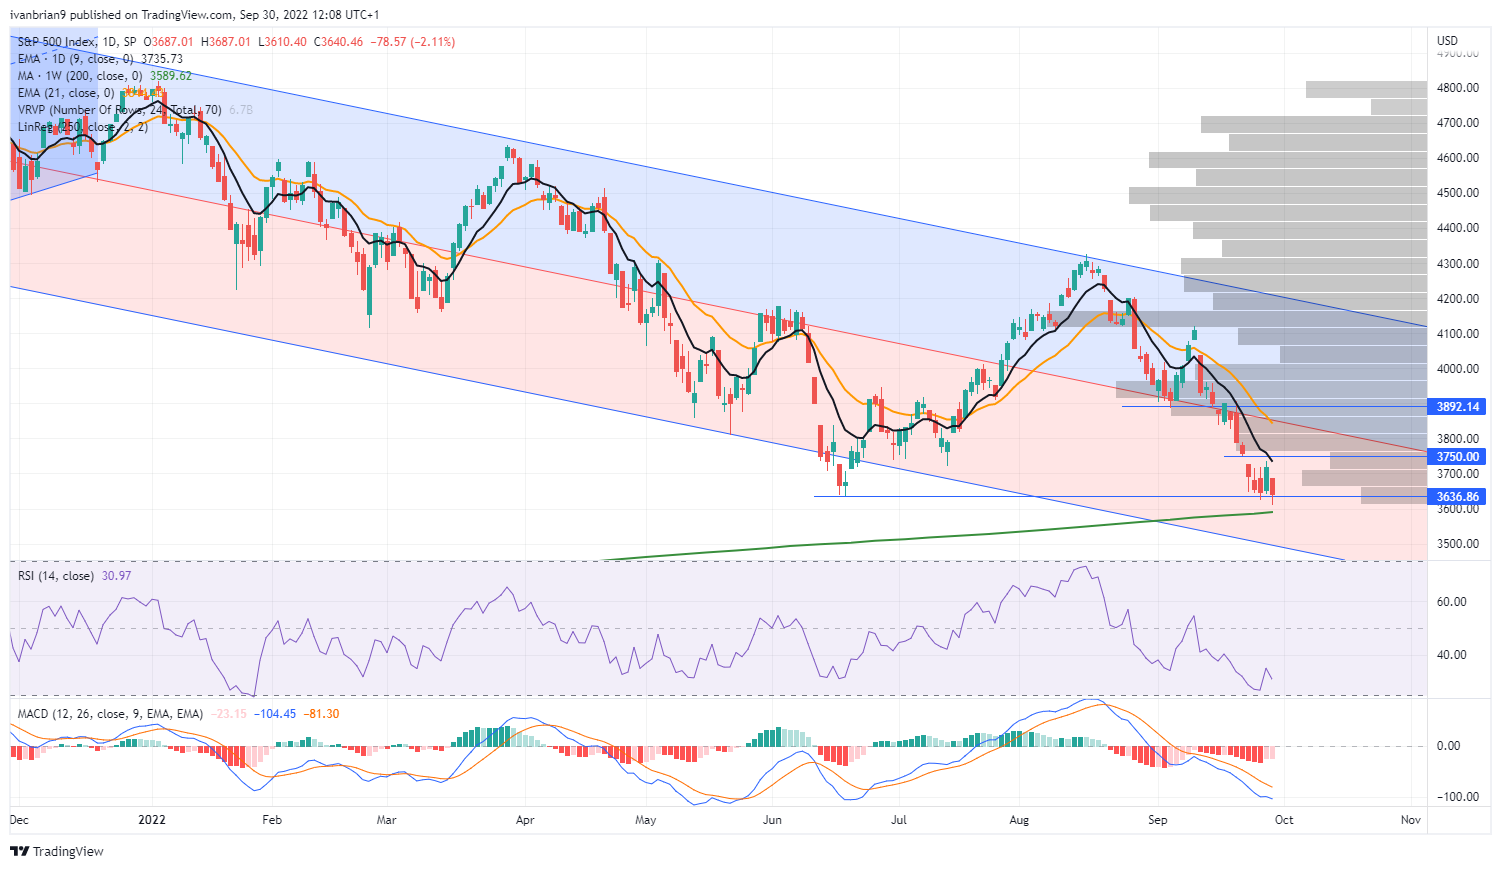
SPX daily
Premium
You have reached your limit of 3 free articles for this month.
Start your subscription and get access to all our original articles.
Author

Ivan Brian
FXStreet
Ivan Brian started his career with AIB Bank in corporate finance and then worked for seven years at Baxter. He started as a macro analyst before becoming Head of Research and then CFO.


