|

S&P500 technical analysis: The consolidation goes on below the 2,900.00 mark

  • The S&P500 extends the consolidation theme for the third day.
  • The level to beat for bulls is 2,910.00.
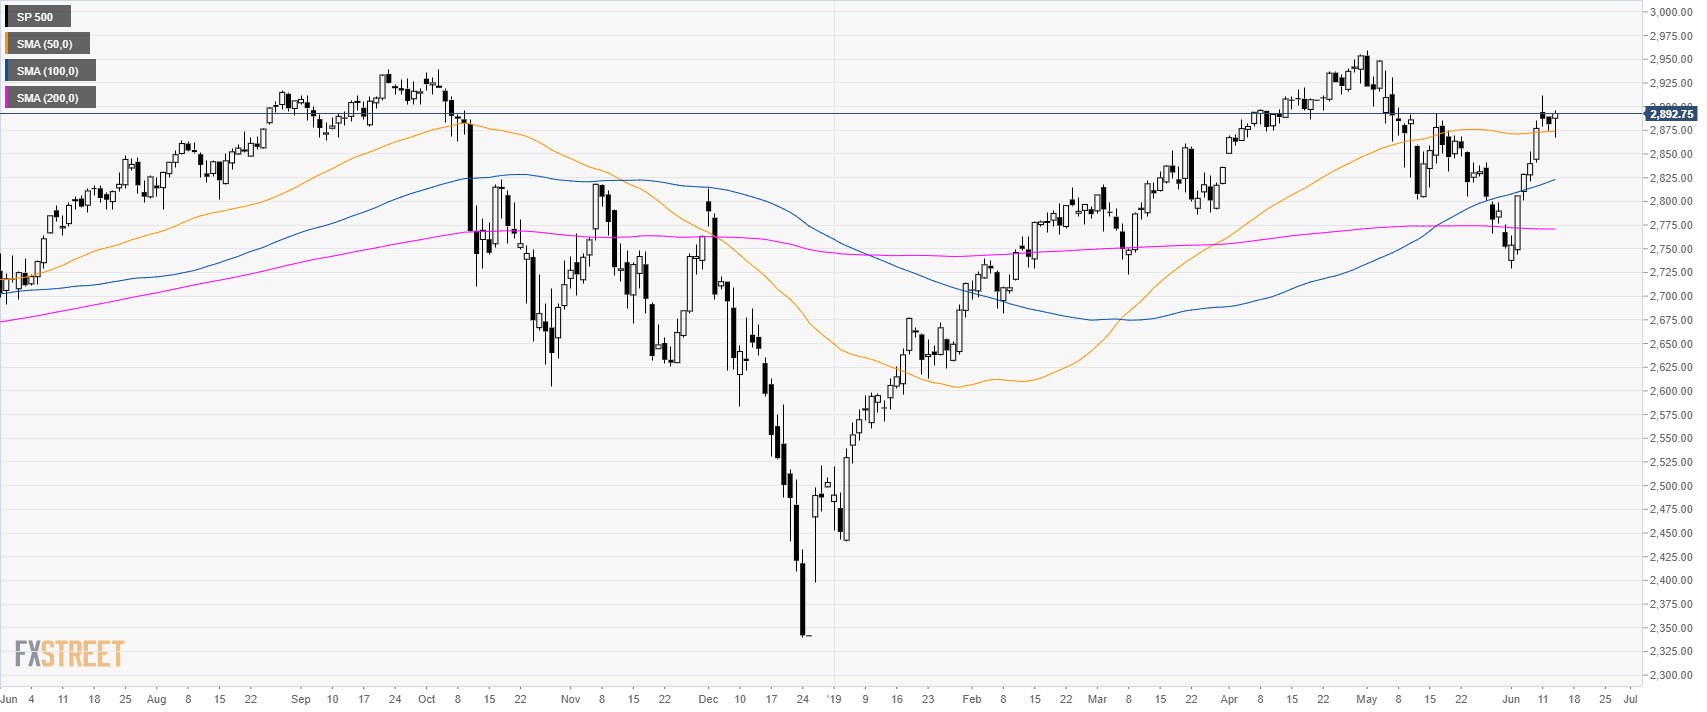
S&P500 daily chart
 
The S&P500 Index is consolidating the recent gains below the 2,900.00 mark. The market is bullish above its main daily simple moving averages (DSMAs).
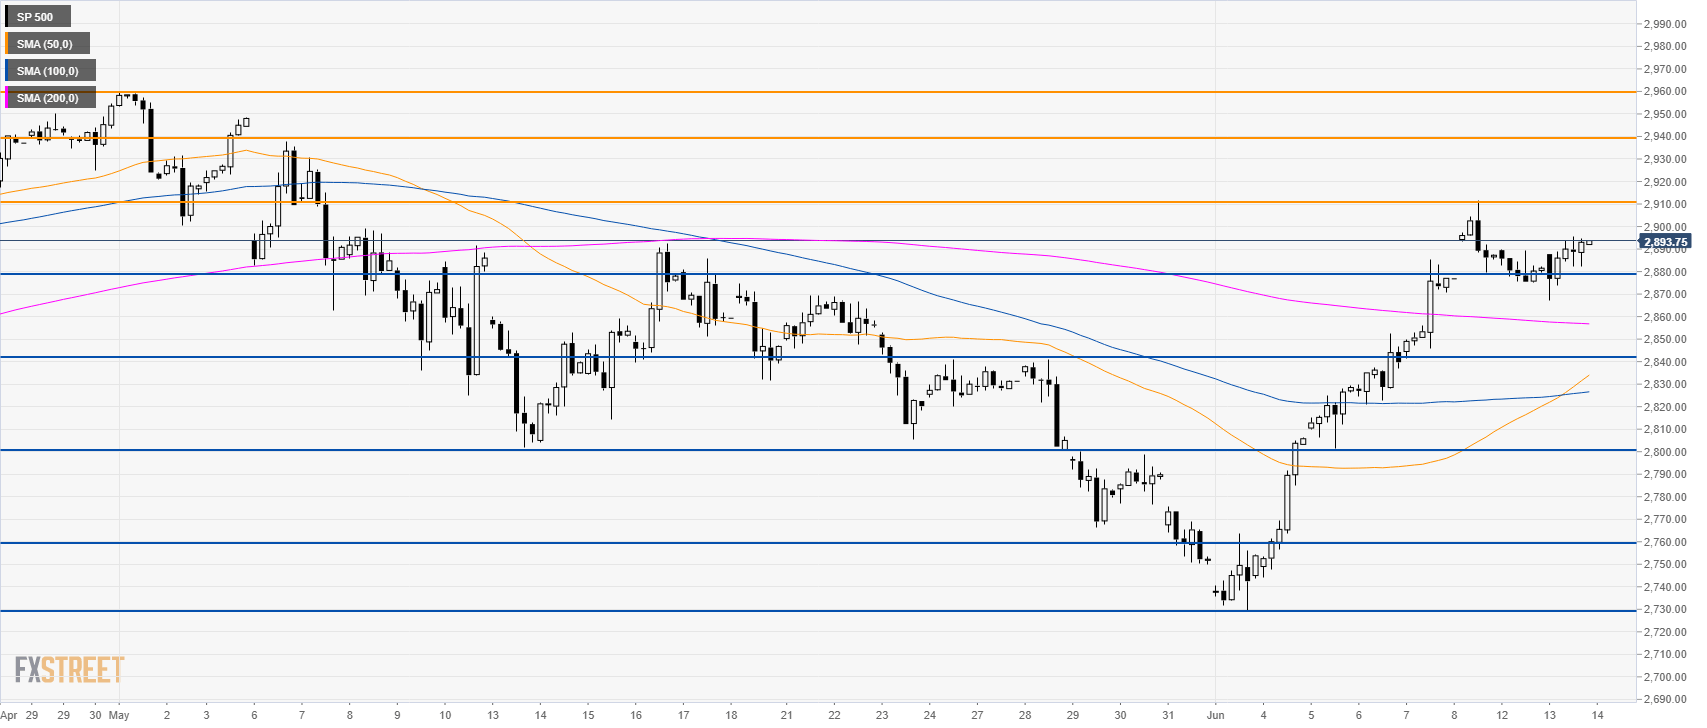

S&P500 4-hour chart


The American stock index is trading above the main SMAs suggesting bullish momentum in the medium term. Bulls need to break 2,910.00 to travel towards 2,940.00 and 2,960.00. Immediate support can be seen at 2,880.00 and 2,840.00.


Additional key levels

SP 500

Overview
Today last price2893.75
Today Daily Change12.25
Today Daily Change %0.43
Today daily open2881.5
 
Trends
Daily SMA202832.25
Daily SMA502874.12
Daily SMA1002830.7
Daily SMA2002763.51
Levels
Previous Daily High2889.75
Previous Daily Low2875.25
Previous Weekly High2885.5
Previous Weekly Low2729.25
Previous Monthly High2959.75
Previous Monthly Low2749.75
Daily Fibonacci 38.2%2880.79
Daily Fibonacci 61.8%2884.21
Daily Pivot Point S12874.58
Daily Pivot Point S22867.67
Daily Pivot Point S32860.08
Daily Pivot Point R12889.08
Daily Pivot Point R22896.67
Daily Pivot Point R32903.58

Author

Flavio Tosti

Flavio Tosti

Independent Analyst


More from Flavio Tosti
Share:

Editor's Picks

EUR/USD loses ground below 1.1850 ahead of FOMC Minutes

The EUR/USD pair loses traction near 1.1840 during the early European session on Wednesday, pressured by renewed US Dollar demand. Traders brace for the Federal Open Market Committee Minutes for signals on future rate cuts, which will be released later on Wednesday. 

When is the UK CPI data and how could it affect GBP/USD?

The United Kingdom Consumer Price Index data for January is scheduled to be published today at 07:00 GMT. GBP/USD trades slightly lower at around 1.3556 as of writing. The 20-period Exponential Moving Average trends lower at 1.3593 and continues to cap rebounds. Price holds beneath this gauge, maintaining a short-term bearish bias.

Gold: Is the $5,000 level back in sight?

Gold snaps a two-day downtrend, as recovery gathers traction toward $5,000 on Wednesday. The US Dollar recovers from the overnight sell-off as rebalancing trades resume ahead of Fed Minutes. The 38.2% Fib support holds on the daily chart for now. What does that mean for Gold?

Pi Network rally defies market pressure ahead of its first anniversary

Pi Network is trading above $0.1900 at press time on Wednesday, extending the weekly gains by nearly 8% so far. The steady recovery is supported by a short-term pause in mainnet migration, which reduces pressure on the PI token supply for Centralized Exchanges. The technical outlook focuses on the $0.1919 resistance as bullish momentum increases.

UK jobs market weakens, bolstering rate cut hopes

In the UK, the latest jobs report made for difficult reading. Nonetheless, this represents yet another reminder for the Bank of England that they need to act swiftly given the collapse in inflation expected over the coming months. 

Top 3 Price Prediction: Bitcoin, Ethereum, and Ripple face downside risk as bears regain control

Bitcoin, Ethereum, and Ripple remain under pressure on Wednesday, with the broader trend still sideways. BTC is edging below $68,000, nearing the lower consolidating boundary, while ETH and XRP also declined slightly, approaching their key supports.