SP500 Elliott Wave update: Is the correction over?

We have been monitoring the SP500 (SPX) to reach approximately 7120 in an Elliott Wave (EW) Principle impulse (five-wave) move upward from the early April lows for a more significant top for some time, and in our previous update from November 10, we were tracking a correction:
“…if the SPX stays above 6631 (last Friday’s actual low), we can expect the W[ave]-5 to reach approximately 7120. However, a daily close below 6720 would be a serious warning for the Bulls that the current rally from Friday’s low is only Wave b of Wave 4, and another move lower (W-c) to around 6575 is likely. Either way, the green W-5 is most likely going to happen.”
Fast forward to today, the index peaked at 6869 on November 12, then closed below 6672 on November 17, signaling the aforementioned C-wave. It then bottomed out at 6521 on November 20 (only 0.8% above the ideal target set ten days earlier!) and is now trading around 6750. Therefore, November 12 was the Wave b of Wave 4, and last Friday marked the end of the W-c of the (green) W-4 correction. See Figure 1 below.
Figure 1. Elliott Wave count for the SPX since the April low
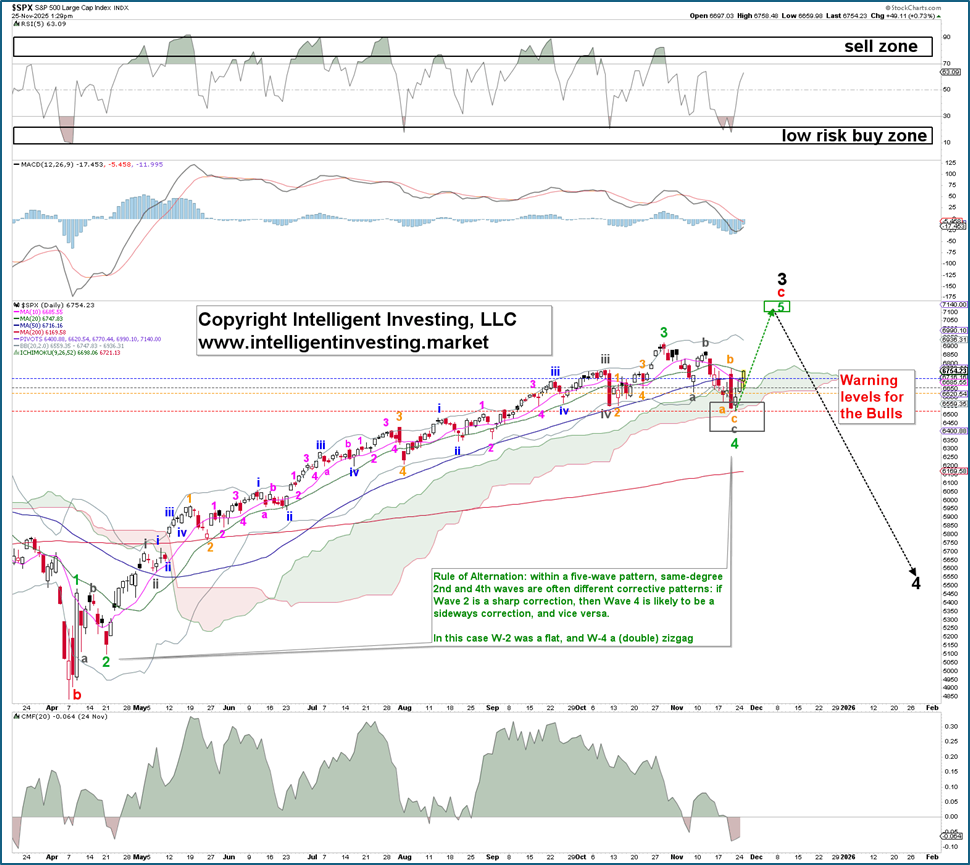
Additionally, the correction this month best qualifies as a (double) zigzag, while the April 10-21 correction best qualifies as a flat, which meets the EW’s “rule of alternation”. Thus, contingent on the SPX holding above last Friday’s low at 6521, with a serious warning for the Bulls below 6630 (Monday’s low), we can allow for the index to rally to 7120+.
To support our bullish outlook, we are also watching for a potential Zweig Breadth Thrust event. See Figure 2 below. The Breadth Thrust Indicator is a technical analysis tool that measures market momentum by comparing the number of advancing stocks to the total number of stocks traded. It signals potential bullish market conditions when the indicator rises from below 40% to above 61.5% within a 10-day period.
Figure 2. Monitoring Zweig Breadth for a potential Thrust event by December 5
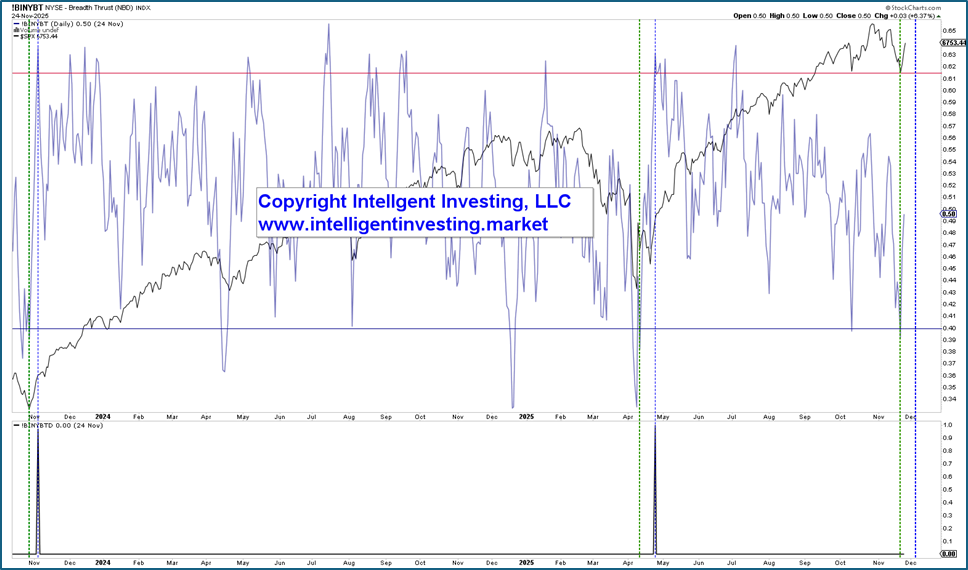
In this case, the indicator closed at 39.2% on November 20 and therefore needs to close above 61.5% by December 5. Yesterday, it was at 0.50. The previous two signals were issued on April 24, 2025, and November 3, 2024. Both led to significant market rallies. Since 1940, this indicator has had an overall success rate of about 84% and an average annual gain of about 23%.
Author

Dr. Arnout Ter Schure
Intelligent Investing, LLC
After having worked for over ten years within the field of energy and the environment, Dr.


