S&P/ASX 200 Elliott Wave technical analysis [Video]
![S&P/ASX 200 Elliott Wave technical analysis [Video]](https://editorial.fxstreet.com/images/Markets/Equities/SP500/wall_street_nyse2-637299021353183737_XtraLarge.jpg)
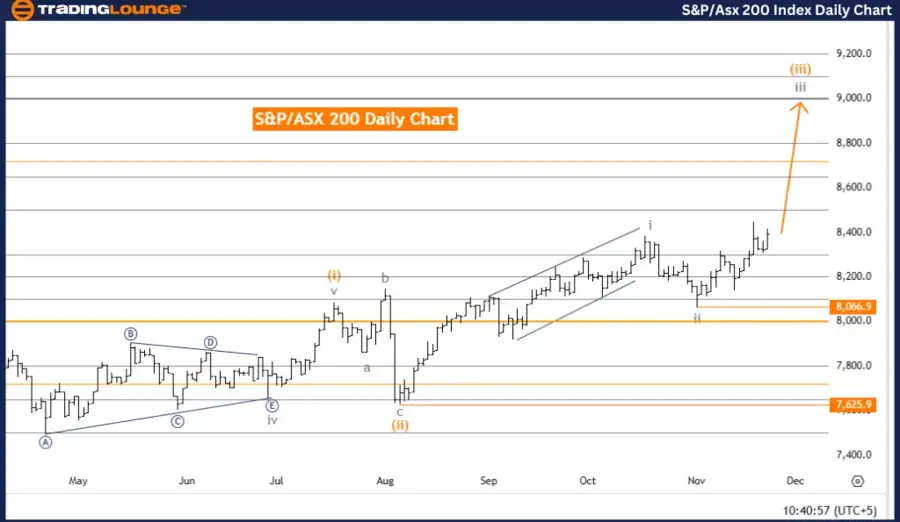
S&P/ASX 200 Elliott Wave Analysis Trading Lounge Day Chart
S&P/ASX 200 Elliott Wave technical analysis
-
Function: Bullish Trend.
-
Mode: Impulsive.
-
Structure: Gray Wave 3.
-
Position: Orange Wave 3.
-
Direction (next higher degrees): Gray Wave 3 (started).
- Details: Gray wave 2 appears completed, and gray wave 3 is now in progress.
-
Wave cancel invalidation level: 8,066.9.
Market analysis overview
This analysis evaluates the S&P/ASX 200 index using Elliott Wave theory on a daily chart, identifying a bullish trend with an impulsive mode.
Key wave structure
-
Current Focus: Gray wave 3, which started after the completion of gray wave 2, marks the initiation of a strong upward trend.
-
Current Position: Orange wave 3, a sub-wave within the larger gray wave 3 structure, is driving the ongoing bullish momentum.
Next market movements
The upward trend is expected to continue with gray wave 3 advancing further. This impulsive phase signals additional gains as the bullish momentum strengthens.
Invalidation level
A critical invalidation level is set at 8,066.9. If the index drops to this level, the current wave count and bullish outlook will no longer hold, necessitating a reassessment of the trend and potential adjustments to trading strategies. This benchmark is essential for risk management and position monitoring.
Conclusion
The Elliott Wave analysis indicates the S&P/ASX 200 index is in a bullish phase, with gray wave 3 unfolding:
-
The completion of gray wave 2 confirms the start of this upward trend.
-
Orange wave 3 is driving the current movement within gray wave 3, supporting continued bullish momentum.
-
Traders should watch the invalidation level at 8,066.9 to reassess positions if necessary.
Overall, the index is expected to sustain its bullish trajectory, presenting opportunities for further gains as gray wave 3 develops.
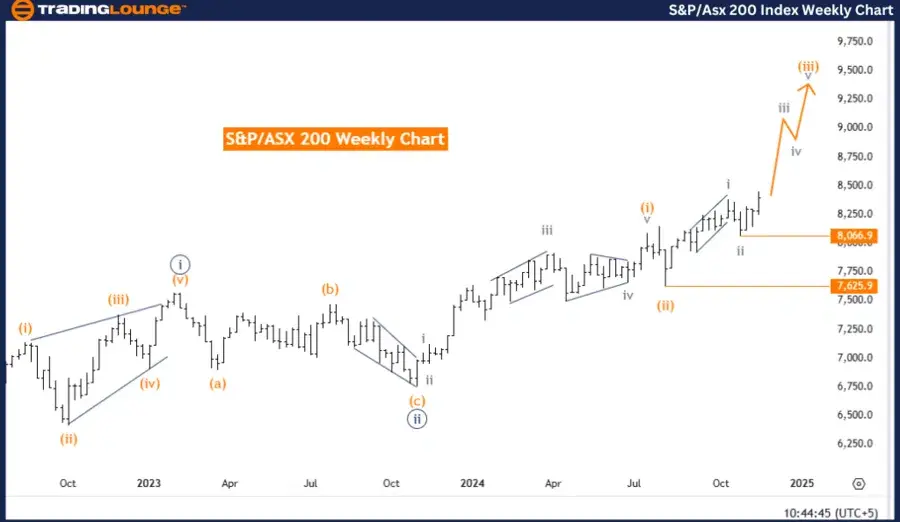
S&P/ASX 200 Elliott Wave Analysis Trading Lounge Weekly Chart.
S&P/ASX 200 Elliott Wave technical analysis
-
Function: Bullish Trend.
-
Mode: Impulsive.
-
Structure: Gray Wave 3.
-
Position: Orange Wave 3.
-
Direction (next lower degrees): Gray Wave 4.
- Details: Gray wave 2 appears completed, and gray wave 3 is now in progress.
-
Wave cancel invalidation level: 8,066.9
Market analysis overview
This analysis evaluates the S&P/ASX 200 index using Elliott Wave theory on a weekly chart, emphasizing a bullish trend in an impulsive mode.
Key wave structure
-
Primary Focus: Gray wave 3, which began after the completion of gray wave 2, marks the start of a strong bullish phase.
-
Current Position: Orange wave 3, a sub-wave within gray wave 3, is driving the current upward movement.
Next market movements
The bullish momentum is expected to continue with gray wave 3 advancing further. Upon its completion, the market is likely to transition into gray wave 4, a corrective phase.
Invalidation level
The invalidation level for this wave structure is 8,066.9. If the index falls to this level, the current wave count and bullish outlook would be invalidated, requiring a reassessment of trading strategies. This benchmark is essential for monitoring risk and validating the trend.
Conclusion
The Elliott Wave analysis confirms the S&P/ASX 200 index is in a bullish phase, driven by gray wave 3:
-
The completion of gray wave 2 confirms the beginning of the current upward trend.
-
Orange wave 3 is leading the ongoing bullish movement within the larger structure.
-
The bullish outlook remains valid as long as the index stays above the invalidation level of 8,066.9.
The analysis forecasts further gains within gray wave 3 before transitioning to the corrective phase of gray wave 4. This insight provides a valuable guide for traders to align their strategies with the broader market trend.
S&P/ASX 200 Elliott Wave technical analysis [Video]
Author

Peter Mathers
TradingLounge
Peter Mathers started actively trading in 1982. He began his career at Hoei and Shoin, a Japanese futures trading company.


