S&P 500’s uncertainty and Apple’s resistance level

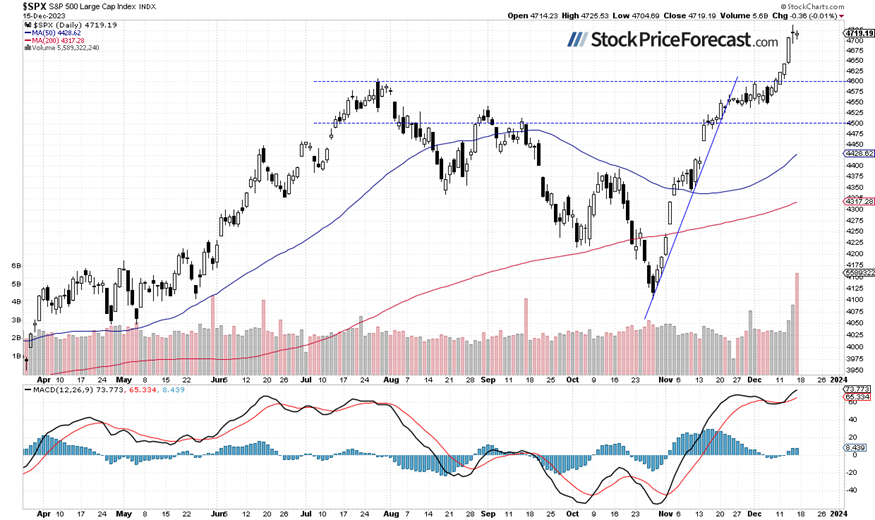
The S&P 500 index lost 0.01% on Friday as it went sideways following the recent rally. On Wednesday and Thursday the market rallied after the FOMC Statement release and on Friday investors were taking some profits off the table. On Thursday the daily high was at 4,738.57, and it was the highest since January of 2022.
On Wednesday the Fed has basically announced a pivot in its monetary policy – stocks, bond prices, precious metals rallied, and the U.S. dollar sold off. Recently the S&P 500 broke above its late July local high of around 4,607. It resumed the rally from October 27 local low of 4,103.78.
Stocks are expected to open 0.2% higher today. So the S&P 500 will further extend its short-term consolidation and for now, a relatively flat correction of the recent advances. The S&P 500 remains close to its new yearly high as we can see on the daily chart:
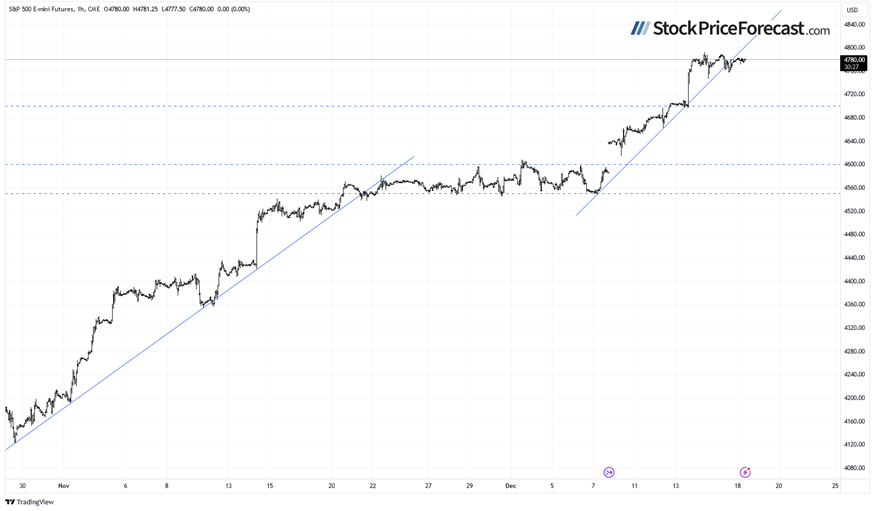
Futures contract trades along 4,780
Let’s take a look at the hourly chart of the S&P 500 futures contract. It is still trading sideways. The nearest important resistance level is at 4,790-4,800 and the support level is at 4,750, among others.
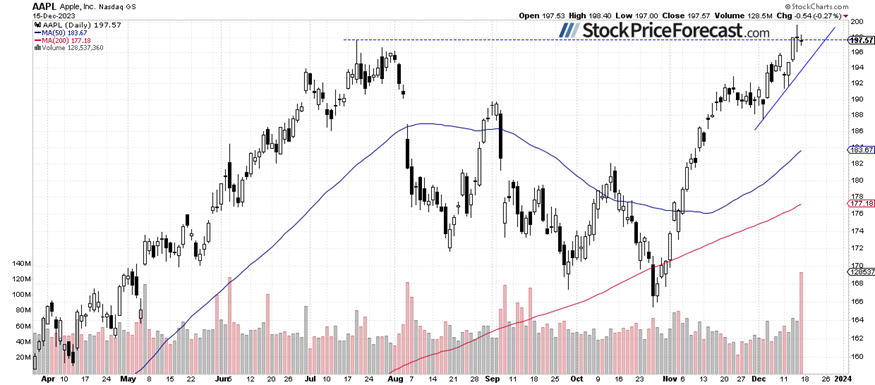
Apple stock is below important $200 Mark
Let’s move on to an individual stock. Apple is one of the most important market movers. On Thursday it reached new all-time high price of $199.62. Since then it’s going sideways, just like the broad stock market’s index. It looks like a topping pattern or just some flat correction following the rally. Nevertheless, $200 mark remains an important resistance level here.
Conclusion
The S&P 500 will likely continue its short-term consolidation this morning. On Thursday and Friday there was a profit taking action and uncertainty following the recent rally.
There have been no confirmed negative signals so far, but the market may see a downward correction at some point.
Here’s the breakdown:
-
The S&P 500 trades sideways following its post-Fed rally.
-
There may be a downward correction at some point.
-
In my opinion, the short-term outlook is still bullish.
Want free follow-ups to the above article and details not available to 99%+ investors? Sign up to our free newsletter today!
Want free follow-ups to the above article and details not available to 99%+ investors? Sign up to our free newsletter today!
Author

Paul Rejczak
Sunshine Profits
Paul Rejczak is a stock market strategist who has been known for the quality of his technical and fundamental analysis since the late nineties.


