|

S&P 500 Price Analysis: Technical lines drawn as America continues burning – Confluence Detector

President Donald Trump threatens to bring in the army and New York is under curfew amid growing protests. Stock markets are unsure of what do, as the unfolding events may trigger further fiscal stimulus. How is the S&P 500 positioned on the charts? 

The Technical Confluences Indicator is showing that some support awaits at 3,038, which is a cluster of lines including the Fibonacci 38.2% one-day, the SMA 5-15m, the Bollinger Band 1h-Middle, and the SMA 10-4h.

Stronger support awaits at 3,023, which is the convergence of the Pivot Point one-day Support 1, the previous daily low, and the previous 4h-low.

Looking up, minor resistance awaits at 3,042, which is the confluence of the SMA 10-15m, and the Fibonacci 23.6% one-week. 

The upside target for the S&P 500 Index is 3,070, where the Bollinger Band 1h-Upper and the previous monthly high converge. 

Here is how it looks on the tool:
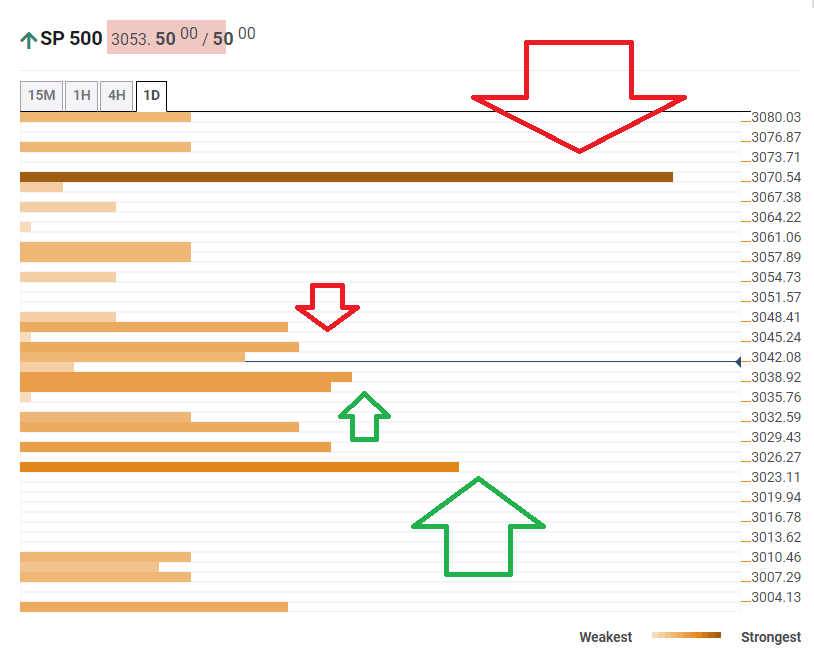
Confluence Detector

The Confluence Detector finds exciting opportunities using Technical Confluences. The TC is a tool to locate and point out those price levels where there is a congestion of indicators, moving averages, Fibonacci levels, Pivot Points, etc. Knowing where these congestion points are located is very useful for the trader, and can be used as a basis for different strategies.

This tool assigns a certain amount of “weight” to each indicator, and this “weight” can influence adjacents price levels. These weightings mean that one price level without any indicator or moving average but under the influence of two “strongly weighted” levels accumulate more resistance than their neighbors. In these cases, the tool signals resistance in apparently empty areas.

Learn more about Technical Confluence

Author

Yohay Elam

Yohay Elam

FXStreet

Yohay is in Forex since 2008 when he founded Forex Crunch, a blog crafted in his free time that turned into a fully-fledged currency website later sold to Finixio.

More from Yohay Elam
Share:

Editor's Picks

EUR/USD meets initial support around 1.1800

EUR/USD remains on the back foot, although it has managed to reverse the initial strong pullback toward the 1.1800 region and regain some balance, hovering around the 1.1850 zone as the NA session draws to a close on Tuesday. Moving forward, market participants will now shift their attention to the release of the FOMC Minutes and US hard data on Wednesday.
 

GBP/USD bounces off lows, retargets 1.3550

After bottoming out just below the 1.3500 yardstick, GBP/USD now gathers some fresh bids and advances to the 1.3530-1.3540 band in the latter part of Tuesday’s session. Cable’s recovery comes as the Greenback surrenders part of its advance, although it keeps the bullish bias well in place for the day.

Gold remains offered below $5,000

Gold stays on the defensive on Tuesday, receding to the sub-$5,000 region per troy ounce on the back of the persistent move higher in the Greenback. The precious metal’s decline is also underpinned by the modest uptick in US Treasury yields across the spectrum.

RBNZ set to pause interest-rate easing cycle as new Governor Breman faces firm inflation

The Reserve Bank of New Zealand remains on track to maintain the Official Cash Rate at 2.25% after concluding its first monetary policy meeting of this year on Wednesday.

UK jobs market weakens, bolstering rate cut hopes

In the UK, the latest jobs report made for difficult reading. Nonetheless, this represents yet another reminder for the Bank of England that they need to act swiftly given the collapse in inflation expected over the coming months. 

Ripple slides to $1.45 as downside risks surge

Ripple edges lower at the time of writing on Tuesday, from the daily open of $1.48, as headwinds persist across the crypto market. A short-term support is emerging at $1.45, but a buildup of bearish positions could further weaken the derivatives market and prolong the correction.