S&P 500 gains ground, snapping losing streak to hang on near $4,245
- S&P 500 index climbs back into the 200-day SMA after declining for four straight trading days.
- US equities broadly reversed recent declines following a data beat for US PMI figures.
- US Treasuries saw an uptick in volatility but settled lower, 10-year T-note settled at 4.819% after cracking 5%.

The Standard & Poor's 500 major equity index gained ground on Tuesday, with equities bolstered by firm earnings reporting and a better-than-expected printing for US Purchasing Managers' Index (PMI) figures, with the indicator firmly beating expectations and sending the S&P and other indexes into the green for the first time in over a week.
The headline US Composite PMI reading for October broadly beat the Street, printing at 51 against the previous month's 50.2, and the individual components of the PMI indicator both soundly beat expectations, reversing an expected decline to print higher than August's reading.
US Manufacturing PMI came in at a flat 50.0 versus the expected decline into 49.5, and stepping over September's 49.8 figure; on the Services component, things improved soundly from 50.1 to 50.9, handily crunching the market's forecast of 49.9.
After the US soundly beat the Street, crunching PMI expectations major equities proceeded to rally for the day, snapping a week-long losing streak and sending the S&P 500 back towards $4,260 before settling the day near $4,245.
The S&P climbed 30.64 points to finish the day up 0.73%, while the Dow Jones Industrial Average rose 204.97 points to close out Tuesday at $33,141.38, up 0.0.62%. The big winner for Tuesday was the NASDAQ Composite, which rose 121.55 points to close at $13,139.87, climbing over 0.9% on the day after earnings reports also beat Wall Street expectations.
About 150 companies listed on the S&P are reporting earnings this week, with 23% of the indexes having already reported earnings figures, with 77% of reporters beating analyst estimates.
S&P 500 Technical Outlook
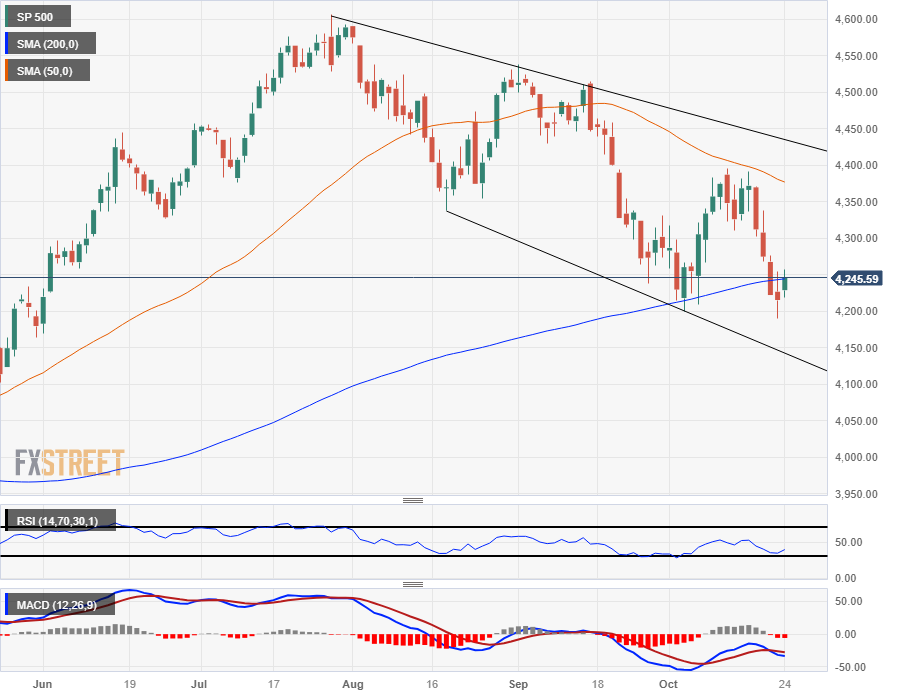
Despite Tuesday's moderate gain, the S&P 500 remains firmly buried in bear country, with the index sticking close to the 200-day Simple Moving Average (SMA) while a descending 50-day SMA adds downside pressure from $4,375.
On the bottom end, Monday's dip into $4,189 saw the index etch in a new four-month as investors continue to weigh their option.
The last swing high sees a technical barrier at the $4,400 handle, while bears will want to establish a medium-term run into the $4,000 major psychological handle in the coming weeks.
S&P 500 Daily Chart
S&P 500 Technical Levels
Author

Joshua Gibson
FXStreet
Joshua joins the FXStreet team as an Economics and Finance double major from Vancouver Island University with twelve years' experience as an independent trader focusing on technical analysis.


