S&P 500 Forecast: Price finds a floor at 4,300 after last week's sharp decline
- S&P 500 lost 2.93% last week, its worst performance since the second week in March.
- US PCE data for Q2 will give investors better view of outlook for inflation.
- August Durable Goods Orders will be released on Wednesday.
- US Bureau of Economic Analysis releases Q2 US GDP print on Thursday.
- Nike, Accenture, Micron Technology release quarterly earnings results.
/stock-market-graph-gm532464153-55981218_XtraLarge.jpg)
The S&P 500 index lost 2.93% last week as the Federal Reserve’s (Fed) September 20 policy meeting spooked investors with the central bank’s lack of interest in cutting interest rates anytime soon. The central bank kept rates unchanged as expected, but Fed Chair Powell’s presser coincided with a “higher for longer” dot plot for interest rates remaining high well into 2025.
This week things are already looking a bit sinister for the index. China Oceanwide, a mainland property developer, was ordered to liquidate by a court in Bermuda. On Sunday, embattled Chinese real estate powerhouse Evergrande said it was unable to raise more debt due to an ongoing investigation into one of its subsidiaries. Both pieces of news follow the bankruptcy filing by a separate Chinese real estate developer called Sunac last Tuesday. The real estate sector in China comprises 25% of the economy, and a continued slowdown in this sector will likely spill over into the global economy, affecting GDP growth for quite a while.
Significant economic indicators this last week of September are rather lacking, but US Personal Consumption Expenditures for Q2, a final Q2 GDP reading, and Durable Goods Orders for August will still turn heads. More important for the S&P 500 will be earnings results from Costco Wholesale (COST), Nike (NKE), Micron Technology (MU) and Accenture (ACN).
S&P 500, NASDAQ 100 and Dow Jones Industrial futures are all down close to 0.4% in Monday’s premarket at the time of writing.
S&P 500 News: Earnings are sparse, but NKE, ACN, MU, COST will receive focus
Costco will be the first out of the gate on Tuesday. Wall Street is expecting their beloved compounder to turn in its fiscal fourth-quarter results (quarter ending in August) much improved from the previous quarter ending in May. That quarter saw adjusted earnings per share (EPS) of $2.93, and analyst consensus now reads $4.82 in adjusted EPS in the tea leaves for Q4, which will be released after the close.
Nike is facing headwinds going into earnings, which will be released on Thursday after the close. Jeffries presented a downgrade on the sportswear stock early Monday, giving the legendary brand a Hold rating and a $100 price target.
"Our consumer survey results indicate that US consumers are likely to reduce spending ahead, with apparel and footwear being the most likely areas of pullback," warned Jeffries analyst Randal Konik.
NKE stock is trading down 1.6% in the Monday premarket. One reason is that with all the negativity out of China, Nike’s quarterly results might look less probable. Analysts have been expecting a 1.6% drop in North American sales, while Greater China is expected to deliver 16% YoY growth. Analysts are expecting the reporting quarter to see sales of $13 billion, an easy achievement, Nike’s outlook for the following quarter will be much more important for price action.
Micron Technology releases results on Wednesday. The stock price will turn on whether Micron’s management team can pull off a smaller loss than expected. The heavily negative sentiment heading into the earnings call has consensus at $-1.18 per share in adjusted EPS on $3.93 billion in sales. MU stock may take off if management sees an end to the poor business cycle for memory chips coming to an end.
Leading consulting firm Accenture will release results on Thursday. Wall Street expects adjusted EPS of $2.63 on $16.06 billion in sales as corporations tighten their belts and reduce spending on outside consultants.
Economic indicators should confirm market stance
Although the S&P 500 index normally rotates based on economic indicators dedicated to the US economy, a lot of investors will keep one eye on China this week due to the raft of worrisome headlines in the real estate industry. HSBC cut its GDP forecast already this morning. The bank cuts 2023 GDP by 40 basis points to 4.9% and 2024 GDP by 30 basis points to 4.6%.
It is a bit sleepy this week on the US data front. Still, there are a few readings to keep in the back of mind. First and foremost, Friday’s August PCE index is forecast to show MoM inflation of 0.2% and annual inflation of 3.9%. The indicator had the same monthly result in July but 4.2% YoY inflation.
Wednesday’s August Durable Goods Orders are expected to decline 0.4%. That is still better than July’s -5.2% contraction.
Thursday’s US GDP results for Q2 are forecast to show annualized growth of 2.3%. This is up from Q1’s 2.1% annualized reading.
Thursday’s PCE data for Q2 is expected to show 2.5% annualized economic growth for the US economy.
Earnings of the week
Tuesday, September 26 - Costco (COST), Cintas (CTAS)
Wednesday, September 27 - Micron Technology (MU), Paychex (PAYX), Jefferies Financial Group (JEF)
Thursday, September 28 - Jabil (JBL), Accenture (ACN), Nike (NKE), Jabil (JBL), CarMax (KMX)
Friday, September 29 - Carnival (CCL)
What they said about the market – Nigel Topper
Finally some good news. Bank of America Securities’s Nigel Topper last week said that its gauge of news sentiment showed a positive risk/reward setup for the S&P 500 over the next 12 months. Strategist Topper uses a data set that scans about 1 million news items per day. It also helps to release this call now after the market has dropped from August through September.
“The Global News Pulse has had a 79% correlation with global equities since 2004 based on backtesting, and historically when the Global News Pulse has been near current levels and rising (Nov-20 and Mar-12), the MSCI All Country World Index (URTH) averaged 13% in the next 12 months.”
S&P 500 FAQs
What is the S&P 500?
The S&P 500 is a widely followed stock price index which measures the performance of 500 publicly owned companies, and is seen as a broad measure of the US stock market. Each company’s influence on the computation of the index is weighted based on market capitalization. This is calculated by multiplying the number of publicly traded shares of the company by the share price. The S&P 500 index has achieved impressive returns – $1.00 invested in 1970 would have yielded a return of almost $192.00 in 2022. The average annual return since its inception in 1957 has been 11.9%.
How are companies chosen to be included in the S&P 500?
Companies are selected by committee, unlike some other indexes where they are included based on set rules. Still, they must meet certain eligibility criteria, the most important of which is market capitalization, which must be greater than or equal to $12.7 billion. Other criteria include liquidity, domicile, public float, sector, financial viability, length of time publicly traded, and representation of the industries in the economy of the United States. The nine largest companies in the index account for 27.8% of the market capitalization of the index.
How can I trade the S&P 500?
There are a number of ways to trade the S&P 500. Most retail brokers and spread betting platforms allow traders to use Contracts for Difference (CFD) to place bets on the direction of the price. In addition, that can buy into Index, Mutual and Exchange Traded Funds (ETF) that track the price of the S&P 500. The most liquid of the ETFs is State Street Corporation’s SPY. The Chicago Mercantile Exchange (CME) offers futures contracts in the index and the Chicago Board of Options (CMOE) offers options as well as ETFs, inverse ETFs and leveraged ETFs.
What factors drive the S&P 500?
Many different factors drive the S&P 500 but mainly it is the aggregate performance of the component companies revealed in their quarterly and annual company earnings reports. US and global macroeconomic data also contributes as it impacts on investor sentiment, which if positive drives gains. The level of interest rates, set by the Federal Reserve (Fed), also influences the S&P 500 as it affects the cost of credit, on which many corporations are heavily reliant. Therefore, inflation can be a major driver as well as other metrics which impact the Fed decisions.
S&P 500 forecast
The S&P 500 index crashed through prior supports at 4,335 and 4,328 last week, and it seems quite likely that 4,300 – the resistance level from early June – won’t hold either. Unless we see a sudden move higher this week, expect the index to drop back to at least to the 4,100 to 4,200 support range in October.
The 9-day Simple Moving Average (SMA) is pulling away below the 21-day SMA, and there is simply no sign that this downtrend is about to reverse itself. Either keep a stiff upper lip and hold, short the index or run for cover. Those are the near-term options as the S&P 500 index creates a new lower low on the daily chart.
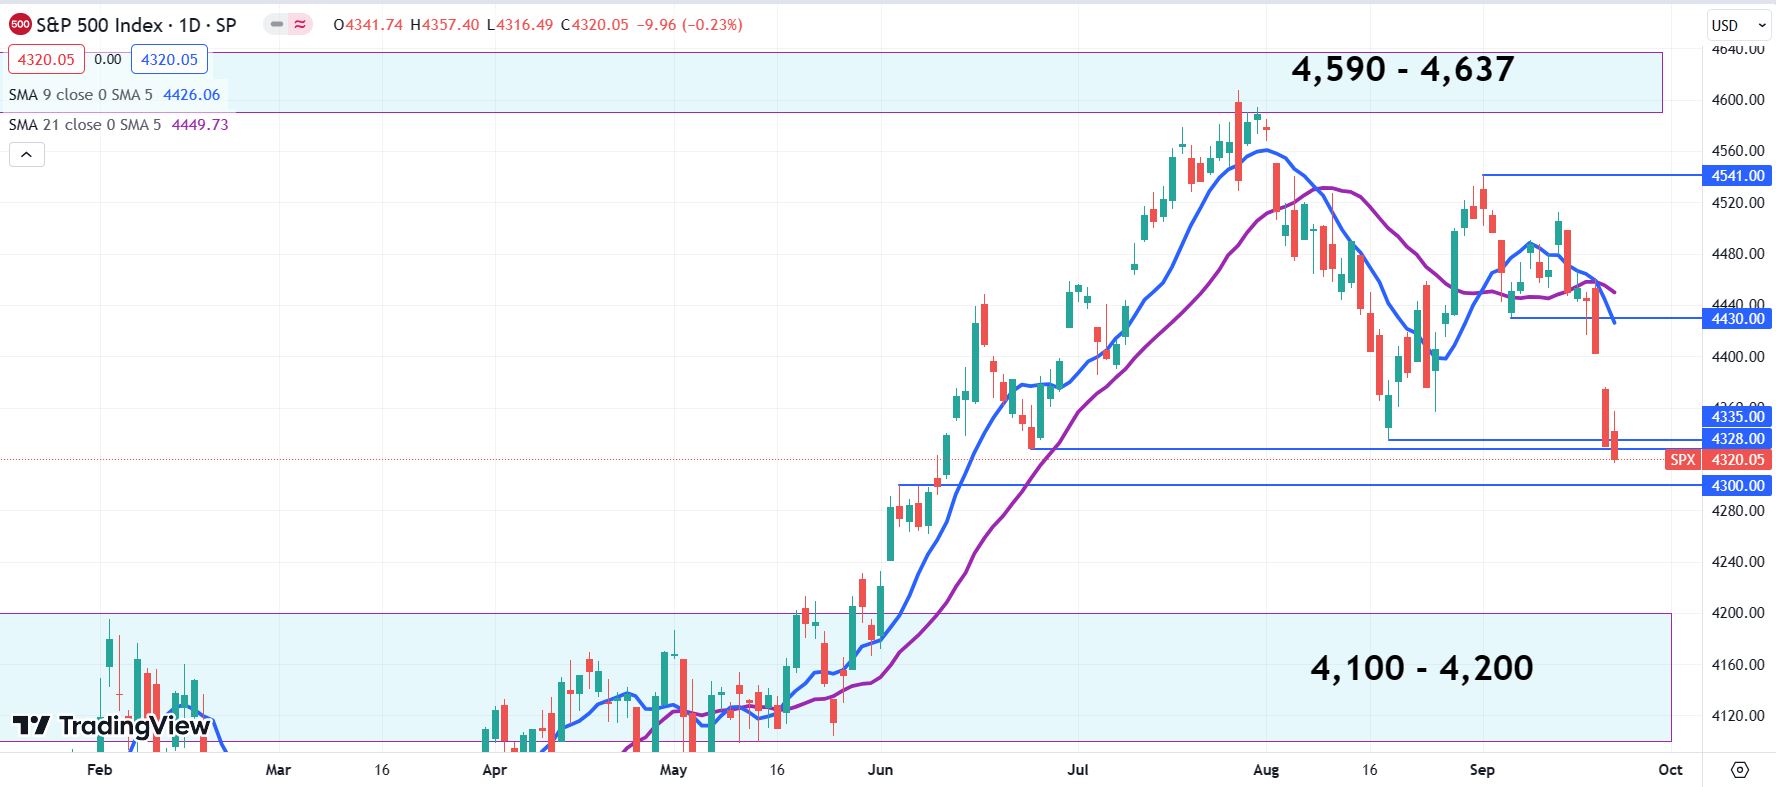
S&P 500 daily chart
Premium
You have reached your limit of 3 free articles for this month.
Start your subscription and get access to all our original articles.
Author

Clay Webster
FXStreet
Clay Webster grew up in the US outside Buffalo, New York and Lancaster, Pennsylvania. He began investing after college following the 2008 financial crisis.


