S&P 500 Forecast: Index recovers on Monday with Target, Walmart, Home Depot earnings ahead
- S&P 500 has given up 2.72% so far in August. The index is in an official short-term downtrend.
- Target, Walmart and Home Depot release quarterly earnings this week.
- US Census Bureau reports July US Retail Sales on Tuesday.

After a shaky start, the S&P 500 is trading higher on Monday. The Index declined last week for its second week in a row, dropping 0.31%.
Monday, August 7, witnessed an impressive rally, but the optimism quickly dissolved as mega-cap stocks pulled back amid higher US Treasury yields. Friday’s hotter-than-expected Producer Price Index (PPI) did not help things as traders digested data showing that inflation was more sticky than previously thought.
This is the week of retail for S&P 500 earnings in the second calendar quarter. Home and construction retail giant The Home Depot (HD) reports earnings on Tuesday. Home Depot earnings will then be followed by Target (TGT) and Walmart (WMT) on Wednesday and Thursday, respectively. Tuesday will also see the release of US Retail Sales for July, which nicely complements the market’s theme. Analysts expect the data to improve at a better clip than in June.
S&P 500 News: Home Depot, Walmart, Target, Cleveland-Cliffs
Some of the biggest names in US retail report results this week. First up is The Home Depot. The dividend stalwart is expected to unveil earnings of $4.44 (“You’re crazy for this one, Rick”) on revenue of $42.19 billion.
That is quite the pullback from a year ago when The Home Depot earned $5.05 per share on sales of $43.79 billion, and analysts (all 28) have uniformly revised their profit expectations lower for the hardware chain over the past three months. In the first quarter (quarter ending in April), The Home Depot missed revenue consensus by more than $1 billion.
Target is yet another retailer that has faced obstacles this past year, including plenty of organized theft that is estimated to be costing the company in the hundreds of millions annually. This quarter Wall Street expects adjusted earnings to arrive at $1.43 per share on $25.26 billion. This would amount to a great increase coming off Target’s profitability low point the same quarter one year ago but would still mean a fall from year-ago revenues of $26.04 billion or a 3% decline.
Earnings beats from either The Home Depot or Target could usher in more optimism for the entire S&P 500 basket of stocks as big box retailers have caused plenty of negativity this year. Target’s share price is down 13.6% YTD, while The Home Depot has only recently reached positive territory but still underperformed the S&P 500 index by a large margin.
Walmart is the major retailer thought to have the best chance of beating earnings this week. Analysts were mixed in their earnings revisions this quarter, but a slight majority raised their outlook on Sam Walton’s empire. Consensus for the second quarter comes to $1.70 in earnings per share on revenue of $159 billion – not bad but still down from $1.77 one year ago.
In addition, much talk has been generated from US Steel’s (X) dismissal of Cleveland-Cliffs (CLF) acquisition offer. On Sunday, the latter said its cash and stock offer amounting to approximately $32.53 a share made on July 27 was rebuffed by US Steel.
The admission has still caused US Steel’s share price to jump more than 27% in Monday’s premarket as the company said it had begun a strategic review and might be open to further offers. Cleveland-Cliffs management says the combined company would become a top-ten global steel producer and create synergies of $500 million.
US Retail Sales forecast for uptick in July
The US Census Bureau will unveil July US Retail Sales an hour before Tuesday’s market opening. Quite optimistically, Wall Street consensus is expecting a 0.4% MoM rise in retail consumption growth, double the 0.2% figure from June. If the results are in line, expect Walmart, The Home Depot and Target, among others, to rally on the news.
Not as significant, but still watched, will be Thursday’s report on Initial Jobless Claims for the week ending August 11. Analysts expect 240K, slightly below the 248K uptick a week earlier.
S&P 500 FAQs
What is the S&P 500?
The S&P 500 is a widely followed stock price index which measures the performance of 500 publicly owned companies, and is seen as a broad measure of the US stock market. Each company’s influence on the computation of the index is weighted based on market capitalization. This is calculated by multiplying the number of publicly traded shares of the company by the share price. The S&P 500 index has achieved impressive returns – $1.00 invested in 1970 would have yielded a return of almost $192.00 in 2022. The average annual return since its inception in 1957 has been 11.9%.
How are companies chosen to be included in the S&P 500?
Companies are selected by committee, unlike some other indexes where they are included based on set rules. Still, they must meet certain eligibility criteria, the most important of which is market capitalization, which must be greater than or equal to $12.7 billion. Other criteria include liquidity, domicile, public float, sector, financial viability, length of time publicly traded, and representation of the industries in the economy of the United States. The nine largest companies in the index account for 27.8% of the market capitalization of the index.
How can I trade the S&P 500?
There are a number of ways to trade the S&P 500. Most retail brokers and spread betting platforms allow traders to use Contracts for Difference (CFD) to place bets on the direction of the price. In addition, that can buy into Index, Mutual and Exchange Traded Funds (ETF) that track the price of the S&P 500. The most liquid of the ETFs is State Street Corporation’s SPY. The Chicago Mercantile Exchange (CME) offers futures contracts in the index and the Chicago Board of Options (CMOE) offers options as well as ETFs, inverse ETFs and leveraged ETFs.
What factors drive the S&P 500?
Many different factors drive the S&P 500 but mainly it is the aggregate performance of the component companies revealed in their quarterly and annual company earnings reports. US and global macroeconomic data also contributes as it impacts on investor sentiment, which if positive drives gains. The level of interest rates, set by the Federal Reserve (Fed), also influences the S&P 500 as it affects the cost of credit, on which many corporations are heavily reliant. Therefore, inflation can be a major driver as well as other metrics which impact the Fed decisions.
Earnings of the week
Monday, August 14 - Rumble (RUM), SNDL (SNDL)
Tuesday, August 15 - Home Depot (HD), On Holding (ONON), and CAVA Group (CAVA).
Wednesday, August 16 - Cisco (CSCO), TJX Companies (TJX), Target (TGT), JD.com (JD)
Thursday, August 17 - Walmart (WMT), Applied Materials (AMAT), Ross Stores (ROST)
Friday, August 18 - Deere (DE), Palo Alto Networks (PANW)
What they said about the market – Jan Hatzius
Goldman Sachs’ revered chief economist Jan Hatzius wrote in a note on Monday that he does not expect the Federal Reserve to wait for a growth scare in order to begin cutting interest rates. This places him in the ever-enlarging "soft landing" camp. However, Hatzius went on record to say that those cuts are unlikely until the second quarter of 2024. That’s about 10 months away (but who’s counting?).
"We expect core PCE inflation to have fallen below 3% on a year-on-year basis and below 2.5% on a monthly annualized basis, and wage growth to have fallen below 4% year-on-year."
S&P 500 forecast
The S&P 500 is in a downtrend. It started on July 27, when the index caved after reaching the 4,590 to 4,637 resistance zone. Then last Wednesday, August 9, the 9-day Simple Moving Average (SMA) finally crossed below the 21-day SMA, and the index has continued to drift lower.
There is some historical support at 4,400, but more ample support exists at 4,300 and 4,325. That is the most likely entry point for bulls. If not, the 4,200 resistance level may turn into support as well.
The Relative Strength Index (RSI) has just crossed below 50, a level it has not seen since March. The daily chart RSI has not touched the accepted oversold level of 30 since last September, so it is unsurprising that the market has decided to hit the breaks. If short-term Treasury yields continue to drift higher, expect the index to experience a deeper pullback than otherwise.
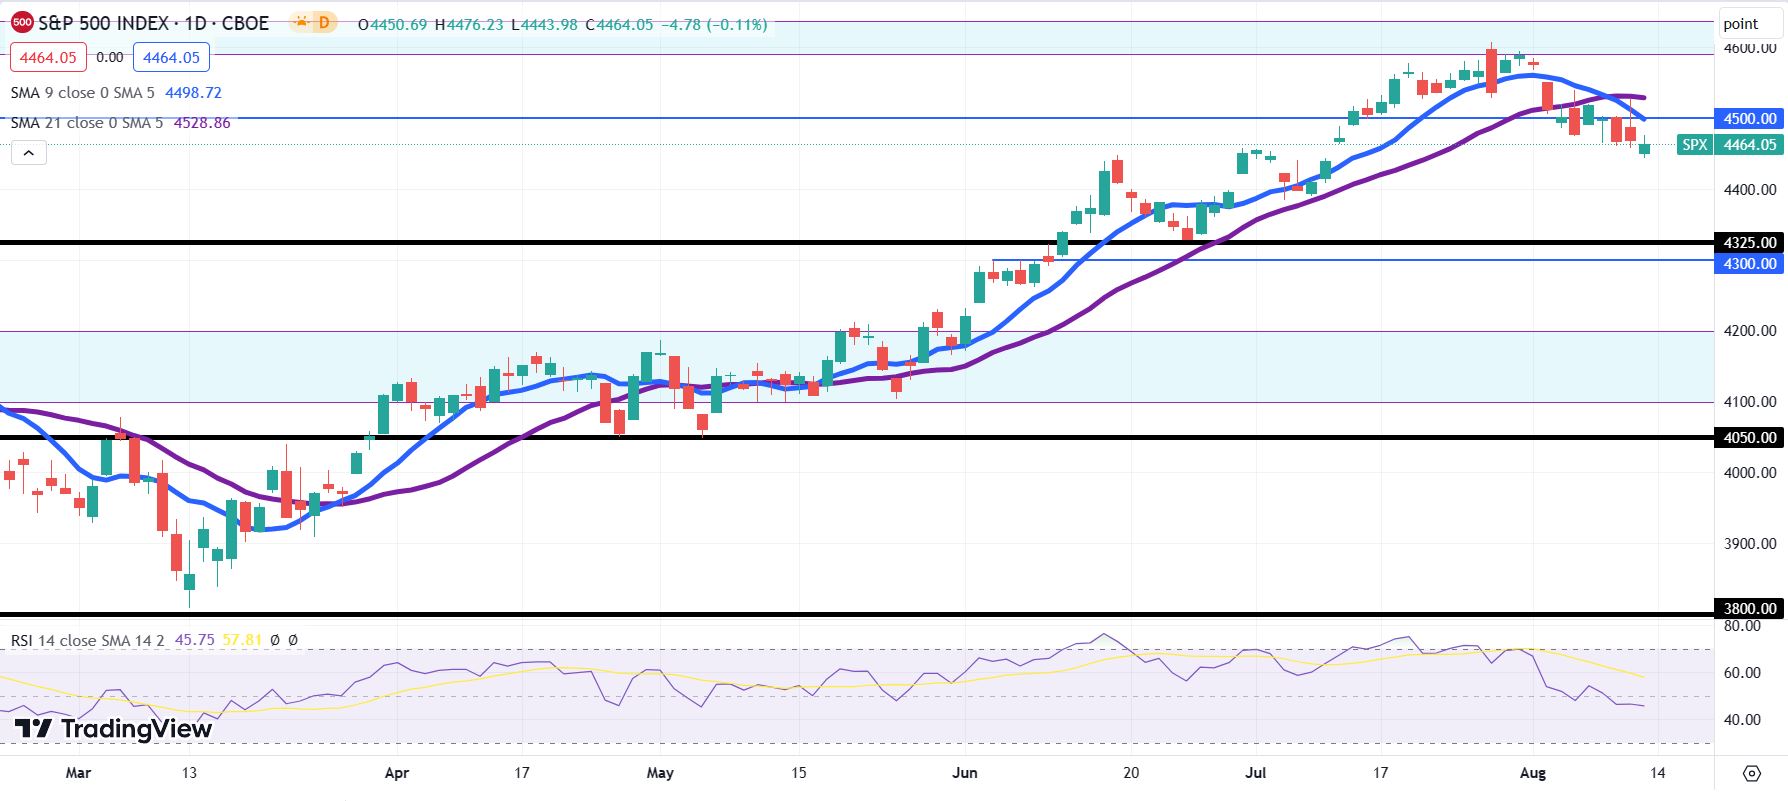
S&P 500 daily chart
Premium
You have reached your limit of 3 free articles for this month.
Start your subscription and get access to all our original articles.
Author

Clay Webster
FXStreet
Clay Webster grew up in the US outside Buffalo, New York and Lancaster, Pennsylvania. He began investing after college following the 2008 financial crisis.


