S&P 500 Elliott Wave technical analysis [Video]
![S&P 500 Elliott Wave technical analysis [Video]](https://editorial.fxsstatic.com/images/i/Equity-Index_S&P500-2.jpg)
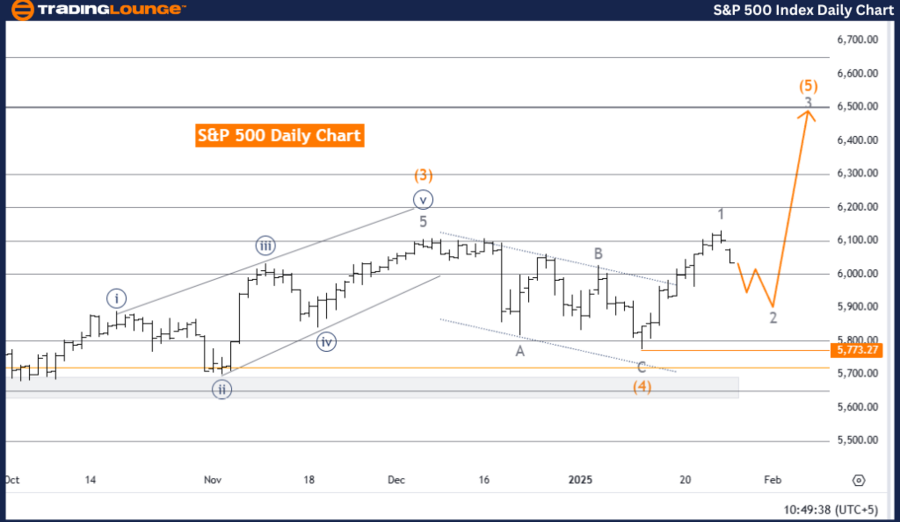
S&P 500 Elliott Wave analysis Trading Lounge day chart.
S&P 500 Elliott Wave technical analysis
Technical overview
-
Function: Counter Trend.
-
Mode: Corrective.
-
Structure: Gray Wave 2.
-
Position: Orange Wave 5.
-
Direction next higher degrees: Gray Wave 3.
-
Details: Gray Wave 1 appears completed; Gray Wave 2 is currently active.
-
Wave cancel invalidation level: 5,773.27.
This analysis reviews the S&P 500 index using Elliott Wave Theory on a daily chart, identifying a counter-trend correction. The primary focus is on Gray Wave 2, which has commenced following the apparent completion of Gray Wave 1, signaling a temporary pause in the broader uptrend.
Currently, the index is positioned within Orange Wave 5, which finalized the previous Gray Wave 1 structure. With Gray Wave 2 now in progress, the market is experiencing a corrective phase aimed at consolidating earlier gains before the anticipated upward continuation through Gray Wave 3.
The designated invalidation level for this wave count is 5,773.27, serving as a critical benchmark. A drop below this threshold would invalidate the current wave count, prompting a reassessment of the market outlook and trading strategies.
Summary
The S&P 500 daily chart analysis highlights an ongoing corrective phase represented by Gray Wave 2, which follows the completion of Gray Wave 1. This consolidation phase provides an opportunity to prepare for the expected emergence of Gray Wave 3, marking the next impulsive movement in the upward trajectory. The invalidation level of 5,773.27 acts as a key risk management tool, helping traders confirm wave structure and align their strategies. This structured analysis offers valuable insights into the market's corrective behavior and guides expectations for the continuation of the broader bullish trend in line with Elliott Wave principles.
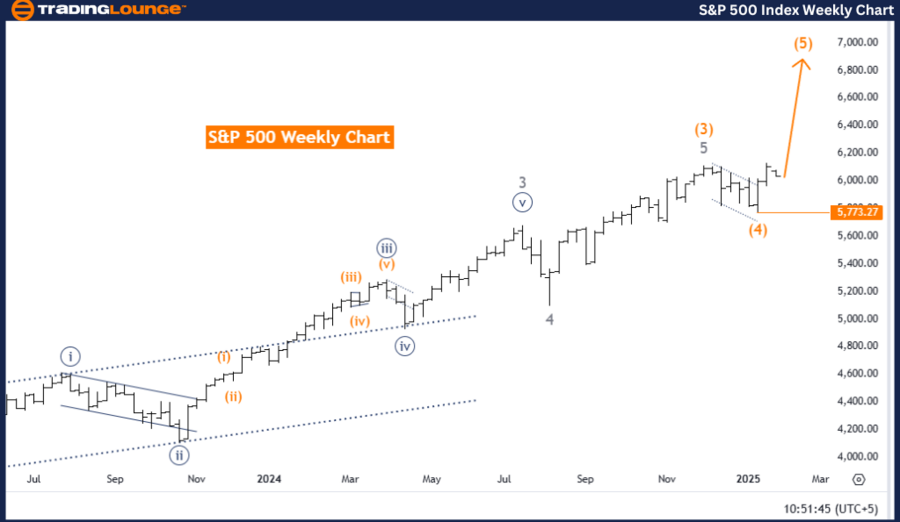
S&P 500 Elliott Wave analysis trading lounge weekly chart.
S&P 500 Elliott Wave technical analysis
Technical overview
-
Function: Bullish Trend.
-
Mode: Impulsive.
-
Structure: Orange Wave 5.
-
Position: Navy Blue Wave 1.
-
Direction next higher degrees: Orange Wave 5 (Started).
-
Details: Orange Wave 4 appears completed; Orange Wave 5 is currently active.
-
Wave cancel invalidation level: 5,773.27.
This analysis focuses on the S&P 500 index using Elliott Wave Theory on a weekly chart, indicating a bullish trend in an impulsive mode. The primary wave under analysis is Orange Wave 5, which has commenced following the completion of Orange Wave 4, signaling the continuation of the broader upward trend.
Currently, the index is positioned within Navy Blue Wave 1, which forms part of the larger Orange Wave 5 structure. The conclusion of Orange Wave 4 confirms the end of the corrective phase, with the development of Orange Wave 5 now driving bullish momentum. This wave is expected to support further upward movement, reinforcing the market's overall bullish outlook.
The invalidation level for this wave count is set at 5,773.27, which acts as a crucial threshold. A decline below this level would invalidate the current wave structure and necessitate a reassessment of the market outlook and trading strategy.
Summary
The weekly S&P 500 chart analysis highlights an ongoing bullish trend, fueled by the completion of Orange Wave 4 and the initiation of Orange Wave 5. The market's current position within Navy Blue Wave 1 suggests renewed upward momentum, with expectations of further growth aligned with higher-degree impulsive movements. The invalidation level at 5,773.27 provides a critical reference point for traders to manage risk and confirm the wave count. This analysis offers key insights into the market’s bullish trajectory, helping traders align their strategies while monitoring crucial levels for potential adjustments.
S&P 500 Elliott Wave technical analysis [Video]
Author

Peter Mathers
TradingLounge
Peter Mathers started actively trading in 1982. He began his career at Hoei and Shoin, a Japanese futures trading company.


