S&P 500 Elliott Wave technical analysis [Video]
![S&P 500 Elliott Wave technical analysis [Video]](https://editorial.fxstreet.com/images/Markets/Equities/SP500/wall-street-sign-637299022550250958_XtraLarge.jpg)
S&P 500 Elliott Wave technical analysis
Function: Bullish Trend.
Mode: Impulsive.
Structure: Navy Blue Wave 1.
Position: Gray Wave 5.
Direction next lower degrees: Navy Blue Wave 2.
Details: Gray Wave 4 appears to be complete, with Navy Blue Wave 1 of 5 now in progress.
Wave cancel invalid level: 5,090.68.
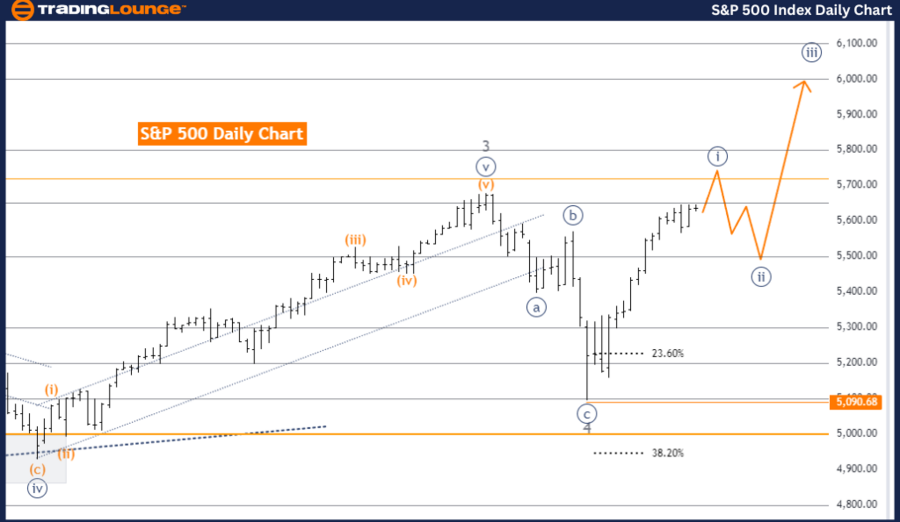
The S&P 500 is currently exhibiting a bullish trend, as highlighted by the Elliott Wave analysis on the daily chart. The market is moving in an impulsive mode, indicating a strong and likely continuation of the current upward trend. The main structure under analysis is Navy Blue Wave 1, which is part of a larger bullish pattern.
At this point, the market is positioned within Gray Wave 5, which represents the final wave of the impulsive sequence before a potential correction may occur. This suggests the market is in the latter stages of its current upward movement, but the bullish trend remains active as the structure indicates that Navy Blue Wave 1 of 5 is currently in play. This implies that following the completion of Gray Wave 4, the market has resumed its upward movement, continuing the impulsive pattern.
The direction for the next lower degrees points to Navy Blue Wave 2, typically a corrective wave that follows the completion of Wave 1. However, the current focus remains on the completion and continuation of Wave 1, indicating that the market is still trending upward before any significant correction or pullback is expected.
A crucial level to watch is 5,090.68, identified as the wave cancel invalid level. If the market falls below this level, it would invalidate the current wave count, potentially signaling a reversal or change in the market's direction. This level serves as a key reference point for traders to confirm the ongoing bullish trend.
In summary, the S&P 500 is currently in a bullish impulsive trend, with the market completing Gray Wave 4 and continuing into Navy Blue Wave 1 of 5. The trend remains upward, but traders should closely monitor the 5,090.68 level, as a drop below this point would invalidate the current wave structure and possibly indicate a trend reversal.
S&P 500 Elliott Wave technical analysis
Function: Bullish Trend.
Mode: Impulsive.
Structure: Gray Wave 5.
Position: Orange Wave 3.
Direction next lower degrees: Orange Wave 4.
Details: Gray Wave 4 appears complete, with Gray Wave 5 now in progress.
Wave cancel invalid level: 5,090.68.
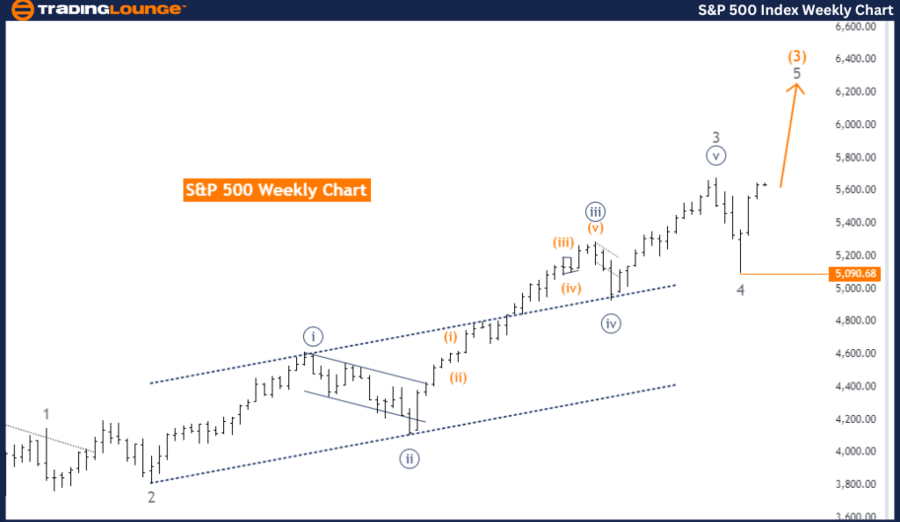
The S&P 500 is currently in a bullish trend according to the Elliott Wave analysis on the weekly chart. The market is following an impulsive mode, indicating strong and continuing upward momentum. The primary structure under analysis is Gray Wave 5, suggesting that the market is in the final phase of its current upward impulsive sequence.
At present, the market is positioned in Orange Wave 3, which is part of the larger Gray Wave 5 structure. This suggests that the market is still experiencing upward movement, with further gains anticipated before any significant correction occurs. The completion of Gray Wave 4 indicates that any recent correction has ended, and the market has resumed its upward trajectory with Gray Wave 5 now actively progressing.
The direction for the next lower degrees points to Orange Wave 4, indicating that after the current upward wave is completed, a corrective phase might follow. However, the immediate focus remains on the continuation of the bullish trend as Gray Wave 5 advances.
A critical level to monitor is 5,090.68, identified as the wave cancel invalid level. If the market were to fall below this level, it would invalidate the current wave structure, indicating a potential change in the market's direction or a trend reversal. This level serves as a key benchmark for traders to confirm the ongoing bullish trend.
In summary, the S&P 500 is in a bullish impulsive trend on the weekly chart, with the market positioned in Orange Wave 3 of Gray Wave 5. The trend remains upward, but traders should closely watch the 5,090.68 level, as a drop below this point would invalidate the current wave structure and could signal a trend reversal.
S&P 500 Elliott Wave technical analysis [Video]
Author

Peter Mathers
TradingLounge
Peter Mathers started actively trading in 1982. He began his career at Hoei and Shoin, a Japanese futures trading company.


