|

S&P 500 Elliott Wave: Retest all-time highs

Executive summary

  • Bullish Trend: SPX is retesting all-time highs at 6,151.
  • Key Support: 5,767 level is the support zone of a decline that may develop.
  • Wave Count: Still no sight of wave 4 decline.

Current Elliott Wave analysis

Chart

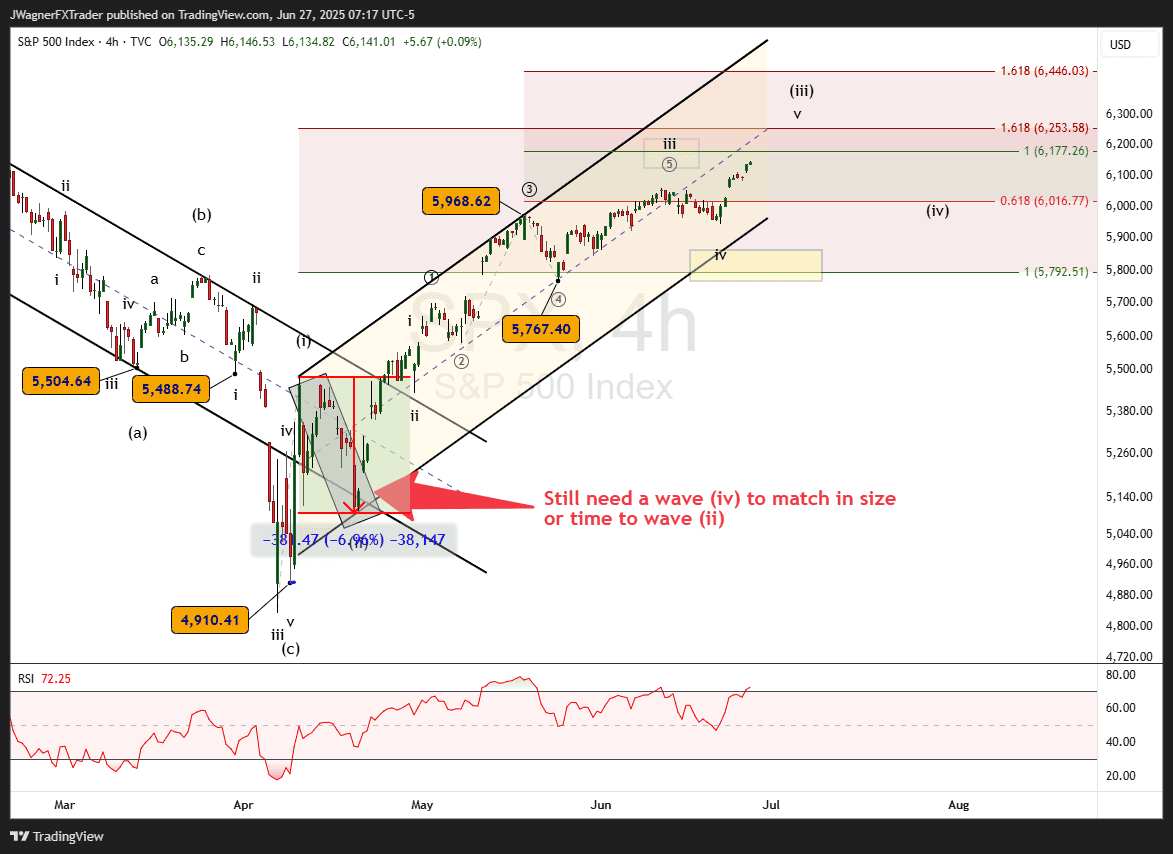
The SPX chart follows an incomplete Elliott Wave impulse pattern as the market climbs in wave (iii). 

Back on May 15, while trading at $5,900, we forecasted a rally to retest the all-time high at $6,151. Now that we have arrived at $6,151, what is next?

It appears the market is still rallying in an extended 3rd wave labeled (iii).

The biggest clue to that assessment is that wave (ii) experienced a 7% decline back in April. Wave (iv) is a cousin wave to (ii), meaning they should have similar depths. It doesn’t have to be exact, but a 5-7% decline would suffice and offer evidence of wave (iv).

Until a decline of that amount appears, wave (iii) may continue to extend higher.

The current all-time high at $6,151 may create a bearish reaction. Don’t be surprised if a breakout above $6,151 creates FOMO and additional panic buying.

Bottom line

SPX remains in a strong bullish uptrend labeled wave (iii). The bullish pattern remains incomplete with the next decline, wave (iv) anticipated to remain soft at 5-7%. 

Author

Zorrays Junaid

Zorrays Junaid

Alchemy Markets

Zorrays Junaid has extensive combined experience in the financial markets as a portfolio manager and trading coach. More recently, he is an Analyst with Alchemy Markets, and has contributed to DailyFX and Elliott Wave Forecast in the past.

More from Zorrays Junaid
Share:

Markets move fast. We move first.

Orange Juice Newsletter brings you expert driven insights - not headlines. Every day on your inbox.

By subscribing you agree to our Terms and conditions.

Editor's Picks

EUR/USD flatlines below 1.1800 amid trading lull, awaits Fed Minutes

EUR/USD trades around a flatline below 1.1800 in European trading on Tuesday. The pair lacks any trading impetus as the US Dollar moves little amid market caution ahead of the Fed's December Meeting Minutes release, which could offer insights into the Federal Reserve’s 2026 outlook.

GBP/USD retakes 1.3500 despite the year-end grind

GBP/USD finds fresh demand and retakes 1.3500 on Tuesday as markets grind through the last trading week of the year. Despite the latest uptick, the pair is unlikely to see further progress due to the year-end holiday volumes.

Gold holds the bounce on Fed rate cut bets, safe-haven flows

Gold holds the rebound near $4,350 in the European trading hours on Tuesday. The precious metal recovers some lost ground after falling 4.5% in the previous session, which was Gold's largest single-day loss since October. Increased margin requirements on gold and silver futures by the Chicago Mercantile Exchange Group, one of the world’s largest trading floors for commodities, prompted widespread profit-taking and portfolio rebalancing.

Tron steadies as Justin Sun invests $18 million in Tron Inc.

Tron (TRX) trades above $0.2800 at press time on Monday, hovering below the 50-day Exponential Moving Average (EMA) at $0.2859.

Economic outlook 2026-2027 in advanced countries: Solidity test

After a year marked by global economic resilience and ending on a note of optimism, 2026 looks promising and could be a year of solid economic performance. In our baseline scenario, we expect most of the supportive factors at work in 2025 to continue to play a role in 2026.

Crypto market outlook for 2026

Year 2025 was volatile, as crypto often is.  Among positive catalysts were favourable regulatory changes in the U.S., rise of Digital Asset Treasuries (DAT), adoption of AI and tokenization of Real-World-Assets (RWA).