Sonic Healthcare Limited Elliott Wave technical analysis [Video]
![Sonic Healthcare Limited Elliott Wave technical analysis [Video]](https://editorial.fxsstatic.com/images/i/Health-Stocks_2_XtraLarge.png)
Our latest Elliott Wave analysis provides an update on the Australian Stock Exchange (ASX) for SONIC HEALTHCARE LIMITED (SHL).
We are currently tracking a possible third wave of upside in ASX:SHL. This analysis will outline key market expectations moving forward, including critical price levels that could either confirm a bullish shift or invalidate the current wave count, impacting the stock’s upside potential.
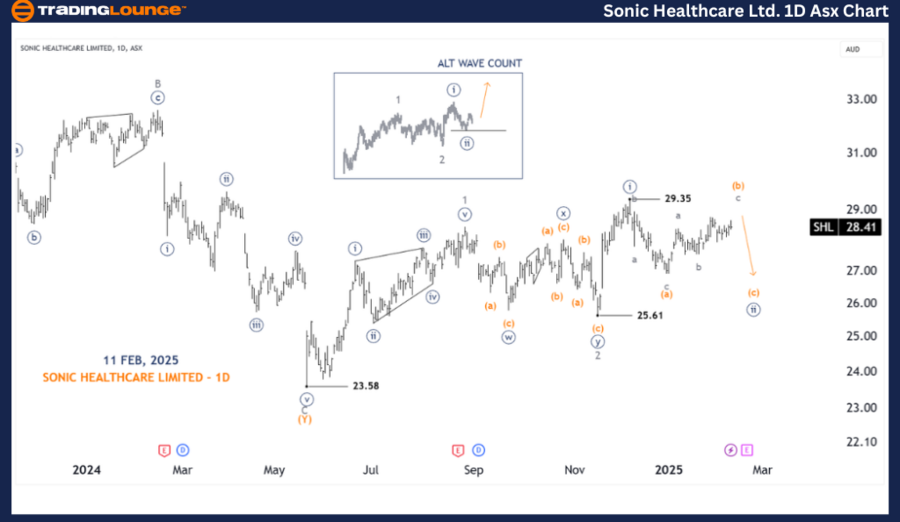
ASX: SHL Elliott Wave technical analysis (one-day chart – Semilog scale)
-
Function: Major trend (Minuette degree, orange).
-
Mode: Motive.
-
Structure: Impulse.
-
Position: Wave ((ii)) - navy of Wave 3 - grey.
-
Details:
-
Wave ((ii)) - navy is moving lower, with a target range around 26.99 - 26.38.
-
A break above 29.35 would signal that Wave ((iii)) - navy is unfolding, as seen in the Alternative Wave Count (ALT WAVE COUNT).
-
This scenario presents strong upside potential for this stock.
-
-
Invalidation point: 25.61.
-
Confirmation point: 29.35.
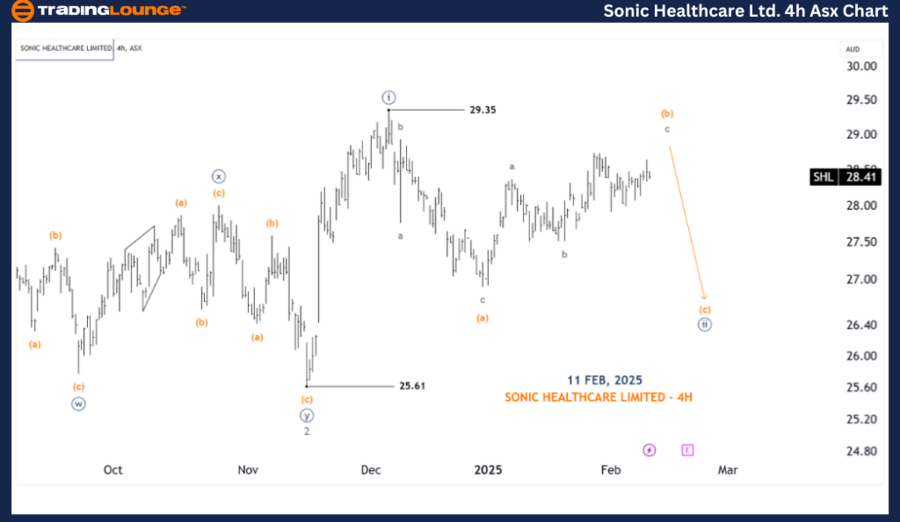
ASX: SHL Elliott Wave technical analysis (four-hour chart analysis)
-
Function: Major trend (Minor degree, grey).
-
Mode: Motive.
-
Structure: Impulse.
-
Position: Wave (c) - orange of Wave ((ii)) - navy.
-
Details:
-
A closer look suggests that Wave ((ii)) - navy is likely developing as a Flat correction or a similar structure, indicating the possibility of a further downside move.
-
The corrective phase in Wave ((ii)) may not be complete, and there could still be a lower wave leg before reversal.
-
Once Wave ((ii)) is finalized, the upcoming Wave ((iii)) is expected to initiate a strong upward trend, moving significantly higher from the 25.61 low.
-
-
Invalidation point: 25.61.
-
Key point: 29.35.
Conclusion
Our Elliott Wave analysis delivers a comprehensive forecast on ASX: SONIC HEALTHCARE LIMITED (SHL), helping traders and investors understand the current market trends and potential trade setups.
By identifying specific price levels, we outline validation and invalidation signals, ensuring confidence in the wave count and market outlook. This structured approach aims to provide an objective and professional perspective on stock movements, allowing traders to capitalize on market opportunities effectively.
Sonic Healthcare Limited Elliott Wave technical analysis [Video]
Author

Peter Mathers
TradingLounge
Peter Mathers started actively trading in 1982. He began his career at Hoei and Shoin, a Japanese futures trading company.


