Silver Price Forecast: XAG/USD wobbles around $36 ahead of US Employment data
- Silver price juggles around $36.00 ahead of the US ADP Employment and NFP data for June.
- Fed’s Bowman warned of labor market risks in June’s last week.
- The US Dollar finds ground while tariff and tax cut bill uncertainty keeps it on the backfoot.

Silver price (XAG/USD) trades in a tight range around $36.00 during European trading hours on Wednesday. The white metal consolidates as investors await the United States (US) Nonfarm Payrolls (NFP) data for June for fresh cues on the Federal Reserve (Fed’s) monetary policy outlook.
Investors will closely monitor the US employment data as comments from a few Fed officials, including Vice Chair for Supervision Michelle Bowman, have signaled increasing labor market risks.
"Should inflation pressures remain contained, I would support lowering the policy rate as soon as our next meeting in order to bring it closer to its neutral setting and to sustain a healthy labor market," Bowman said in June’s last week.
Signs of softening labor market conditions would allow traders to raise bets supporting early interest rate cuts from the Fed. Theoretically, lower interest rates by the Fed bode well for non-yielding assets, such as Silver.
Ahead of the US NFP data, investors await the ADP Employment Change data for June, which will be published at 12:15 GMT. US private employers are expected to have hired 95K fresh workers, significantly higher than 37K in May.
Meanwhile, broader weakness in the US Dollar (USD) continues to support the Silver price. The US Dollar has faced a sharp selling pressure amid uncertainty surrounding the July 9 tariff deadline and fears of widening US fiscal deficit following the imposition of Trump’s so-called “big beautiful bill”.
Heightened global economic uncertainty leads to an increase in demand of safe-haven assets, such as Silver.
However, an unexpected increase in US JOLTS Job Openings data for May has offered support to the US Dollar. The US Dollar Index (DXY) gains a temporary ground after sliding to near 96.40, the lowest level seen since February 2022. At the press time the USD Index rises to near 96.80.
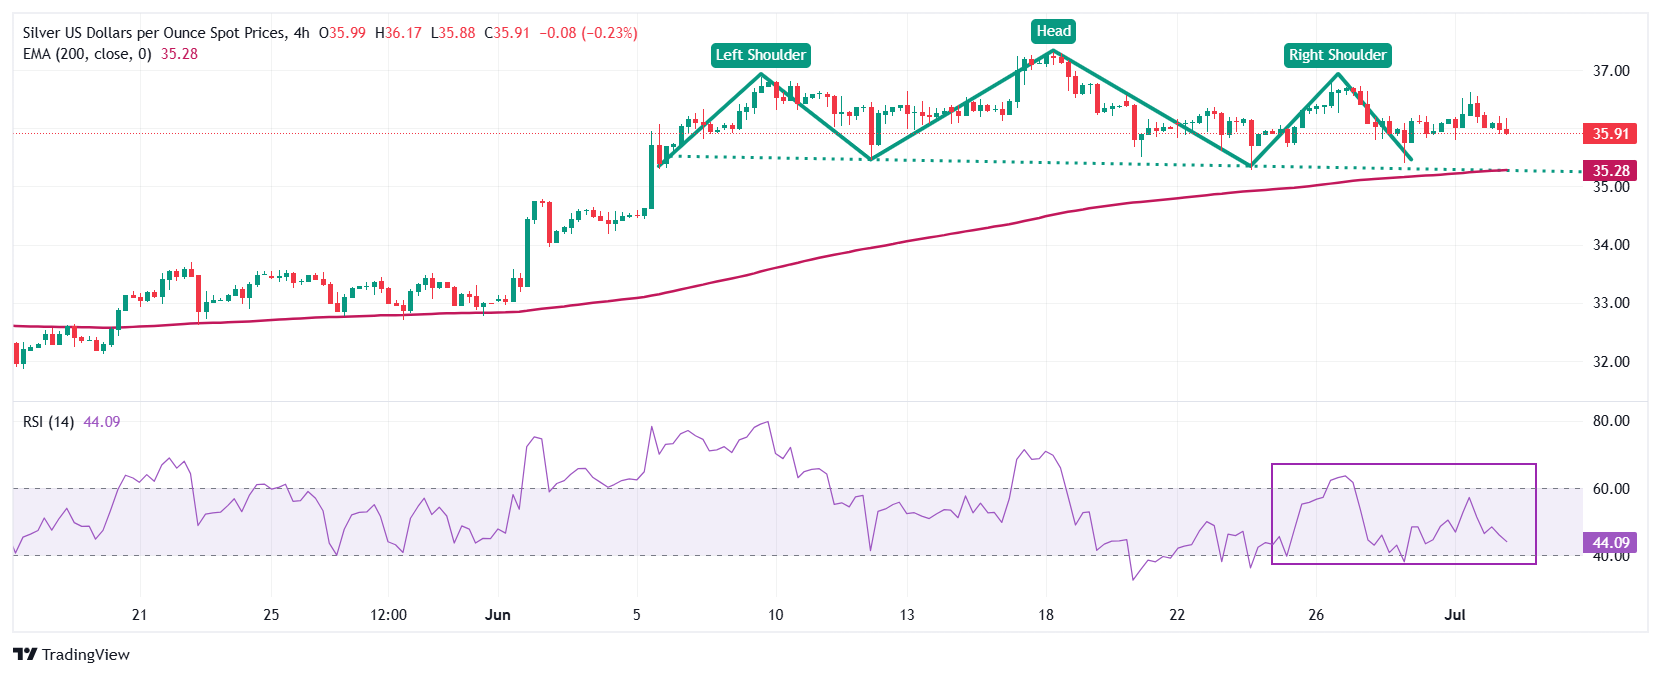
Silver technical analysis
Silver price forms a Head and Shoulder (H&S) chart pattern on a four-timeframe whose breakdown below the neckline results in a bearish reversal. The neckline of the chart pattern is plotted near the Tuesday’s low around $35.28.
The white metal still holds above the 200-period Exponential Moving Average (EMA), suggesting that the long-term trend is still bullish.
The 14-period Relative Strength Index (RSI) slides to near 40.00. A fresh bearish momentum would emerge if the RSI fails to hold above that level.
Looking down, the March 28 high around $34.60 will act as key support for the Silver price. On the upside, the fresh over-a-decade high around $37.32 will be the key barrier.
Silver daily chart
Silver FAQs
Silver is a precious metal highly traded among investors. It has been historically used as a store of value and a medium of exchange. Although less popular than Gold, traders may turn to Silver to diversify their investment portfolio, for its intrinsic value or as a potential hedge during high-inflation periods. Investors can buy physical Silver, in coins or in bars, or trade it through vehicles such as Exchange Traded Funds, which track its price on international markets.
Silver prices can move due to a wide range of factors. Geopolitical instability or fears of a deep recession can make Silver price escalate due to its safe-haven status, although to a lesser extent than Gold's. As a yieldless asset, Silver tends to rise with lower interest rates. Its moves also depend on how the US Dollar (USD) behaves as the asset is priced in dollars (XAG/USD). A strong Dollar tends to keep the price of Silver at bay, whereas a weaker Dollar is likely to propel prices up. Other factors such as investment demand, mining supply – Silver is much more abundant than Gold – and recycling rates can also affect prices.
Silver is widely used in industry, particularly in sectors such as electronics or solar energy, as it has one of the highest electric conductivity of all metals – more than Copper and Gold. A surge in demand can increase prices, while a decline tends to lower them. Dynamics in the US, Chinese and Indian economies can also contribute to price swings: for the US and particularly China, their big industrial sectors use Silver in various processes; in India, consumers’ demand for the precious metal for jewellery also plays a key role in setting prices.
Silver prices tend to follow Gold's moves. When Gold prices rise, Silver typically follows suit, as their status as safe-haven assets is similar. The Gold/Silver ratio, which shows the number of ounces of Silver needed to equal the value of one ounce of Gold, may help to determine the relative valuation between both metals. Some investors may consider a high ratio as an indicator that Silver is undervalued, or Gold is overvalued. On the contrary, a low ratio might suggest that Gold is undervalued relative to Silver.
Author

Sagar Dua
FXStreet
Sagar Dua is associated with the financial markets from his college days. Along with pursuing post-graduation in Commerce in 2014, he started his markets training with chart analysis.


