Silver Price Forecast: XAG/USD stays below $31 with Fed policy under spotlight
- Silver price trades sideways below $31.00 with Fed policy on the horizon.
- The Fed is widely anticipated to pivot to policy normalization.
- The likelihood for the Fed to reduce interest rates by 50 bps is higher.

Silver price (XAG/USD) oscillates below the crucial resistance of $31.00 in Wednesday’s European session. The white metal stays on the sidelines as investors await the Federal Reserve’s (Fed) monetary policy, which will be announced at 18:00 GMT.
The Fed is poised to deliver its first interest rate cut decision in more than four years as officials are worried about deteriorating labor market conditions. However, policymakers remain confident that price pressures are on track to return to the bank’s target of 2%.
With firm speculation that the Fed will pivot to policy normalization, investors will focus on the likely interest rate cut size. According to the CME FedWatch tool, 30-day Federal Funds Futures pricing data shows that the probability of the central bank cutting rates by 50 basis points (bps) to 4.75%-5.00% is 65% and the rest favors a 25-bps rate cut. Apart from the Fed’s policy decision, investors will also focus on the Fed’s dot plot and economic projections.
Ahead of the Fed policy, the US Dollar Index (DXY), which tracks the Greenback’s value against six major currencies, drops to near 100.80. On the contrary, 10-year US Treasury yields jump to near 3.67%. The announcement of the Fed's large rate cut would weigh heavily on the US Dollar and bond yields.
Silver technical analysis
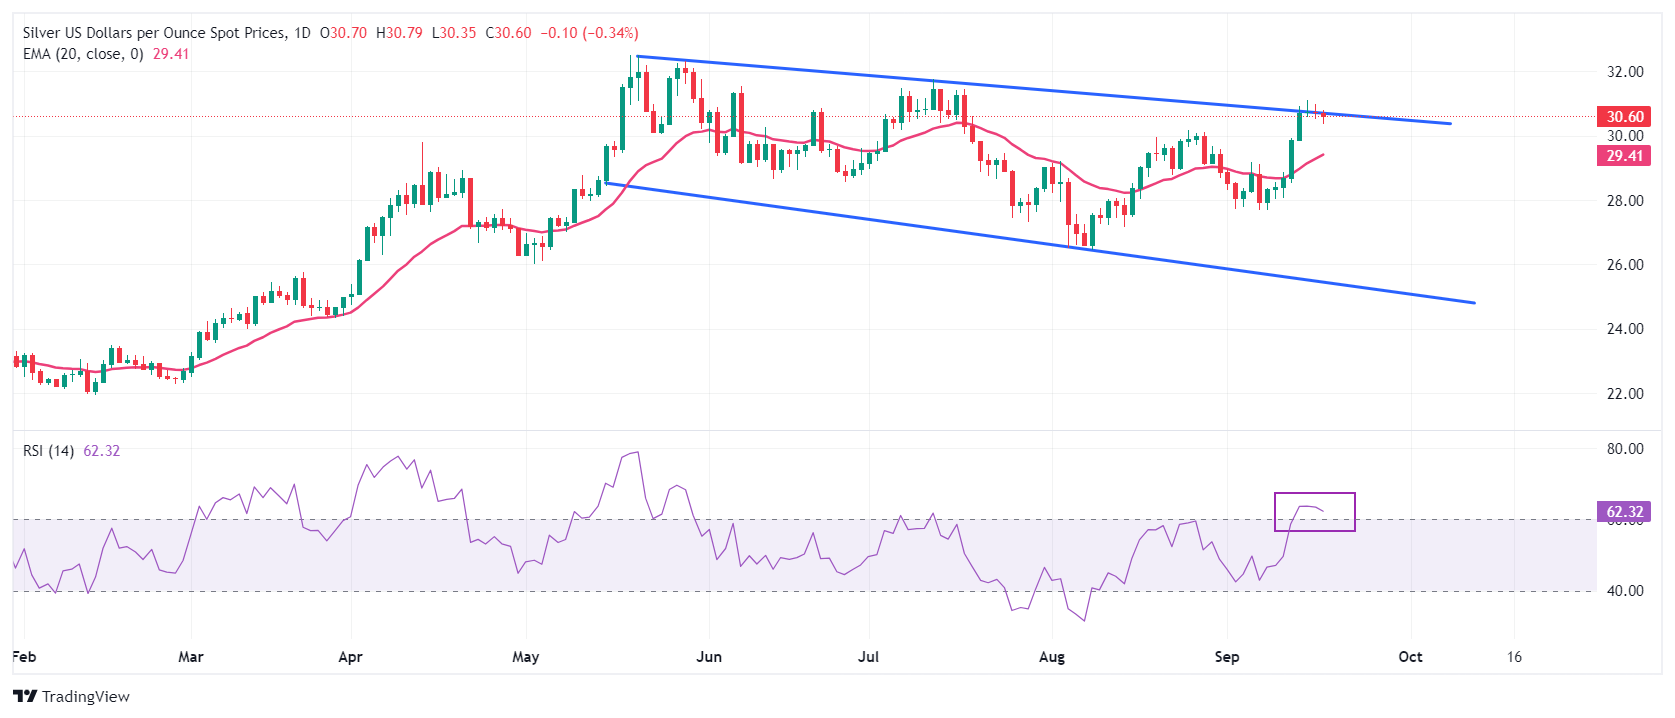
Silver price trades cautiously ahead of the Fed’s interest rate decision. The white metal could a fresh upside if it manages to break above September 16 high of $31.10. The near-term outlook of the Silver price remains firm as the asset holds above the 20-day Exponential Moving Average (EMA), which trades around $29.40.
The 14-day Relative Strength Index (RSI) rises above 60.00. A fresh round of bullish momentum could occur if the oscillator sustains about this level.
Silver daily chart
Silver FAQs
Silver is a precious metal highly traded among investors. It has been historically used as a store of value and a medium of exchange. Although less popular than Gold, traders may turn to Silver to diversify their investment portfolio, for its intrinsic value or as a potential hedge during high-inflation periods. Investors can buy physical Silver, in coins or in bars, or trade it through vehicles such as Exchange Traded Funds, which track its price on international markets.
Silver prices can move due to a wide range of factors. Geopolitical instability or fears of a deep recession can make Silver price escalate due to its safe-haven status, although to a lesser extent than Gold's. As a yieldless asset, Silver tends to rise with lower interest rates. Its moves also depend on how the US Dollar (USD) behaves as the asset is priced in dollars (XAG/USD). A strong Dollar tends to keep the price of Silver at bay, whereas a weaker Dollar is likely to propel prices up. Other factors such as investment demand, mining supply – Silver is much more abundant than Gold – and recycling rates can also affect prices.
Silver is widely used in industry, particularly in sectors such as electronics or solar energy, as it has one of the highest electric conductivity of all metals – more than Copper and Gold. A surge in demand can increase prices, while a decline tends to lower them. Dynamics in the US, Chinese and Indian economies can also contribute to price swings: for the US and particularly China, their big industrial sectors use Silver in various processes; in India, consumers’ demand for the precious metal for jewellery also plays a key role in setting prices.
Silver prices tend to follow Gold's moves. When Gold prices rise, Silver typically follows suit, as their status as safe-haven assets is similar. The Gold/Silver ratio, which shows the number of ounces of Silver needed to equal the value of one ounce of Gold, may help to determine the relative valuation between both metals. Some investors may consider a high ratio as an indicator that Silver is undervalued, or Gold is overvalued. On the contrary, a low ratio might suggest that Gold is undervalued relative to Silver.
Author

Sagar Dua
FXStreet
Sagar Dua is associated with the financial markets from his college days. Along with pursuing post-graduation in Commerce in 2014, he started his markets training with chart analysis.


