Silver Price Forecast: XAG/USD remains below $32 as US yields rebounds ahead of US PCE Inflation
- Silver price faces pressure around $32.00 as US Treasury yields gains ground ahead of the US PCE inflation data for February.
- US President Trump reiterates threats to impose tariffs on Eurozone.
- Investors seek further development on Russia-Ukraine peace.

Silver price (XAG/USD) continues to face selling pressure around $32.00. The white metal is down an almost 0.3% to near $31.70 in European trading hours on Thursday as United States (US) bond yields have bounced back after a six-day losing streak ahead of the US Personal Consumption Expenditure Price Index (PCE) data for January, which will be released on Friday.
10-year US Treasury yields is up 1.3% to near 4.31% at the press time. Technically, higher yields on interest-bearing assets weighs on non-yielding assets, such as Silver.
Economists expect the US core PCE inflation – which excludes volatile food and energy prices – to have decelerated to 2.6% from 2.8% in December on year. Month-on-month inflation data is estimated to have grown by 0.3%, faster than the former reading of 0.2%.
Investors will pay close attention to the US core PCE inflation data as it is will influence market expectations for the Federal Reserve’s (Fed) monetary policy outlook, being a Fed’s preferred inflation gauge.
Meanwhile, US President Donald Trump’s tariff agenda continues to support the Silver price. On Wednesday, Trump reiterates threats to impose 25% tariffs on cars and other things imported from the Eurozone.
On the geopolitical front, investors await meeting of European leaders with United Kingdom (UK) Prime Minister Keir Starmer to discuss over President Trump’s attempt to end war in Ukraine quickly.
Silver technical analysis
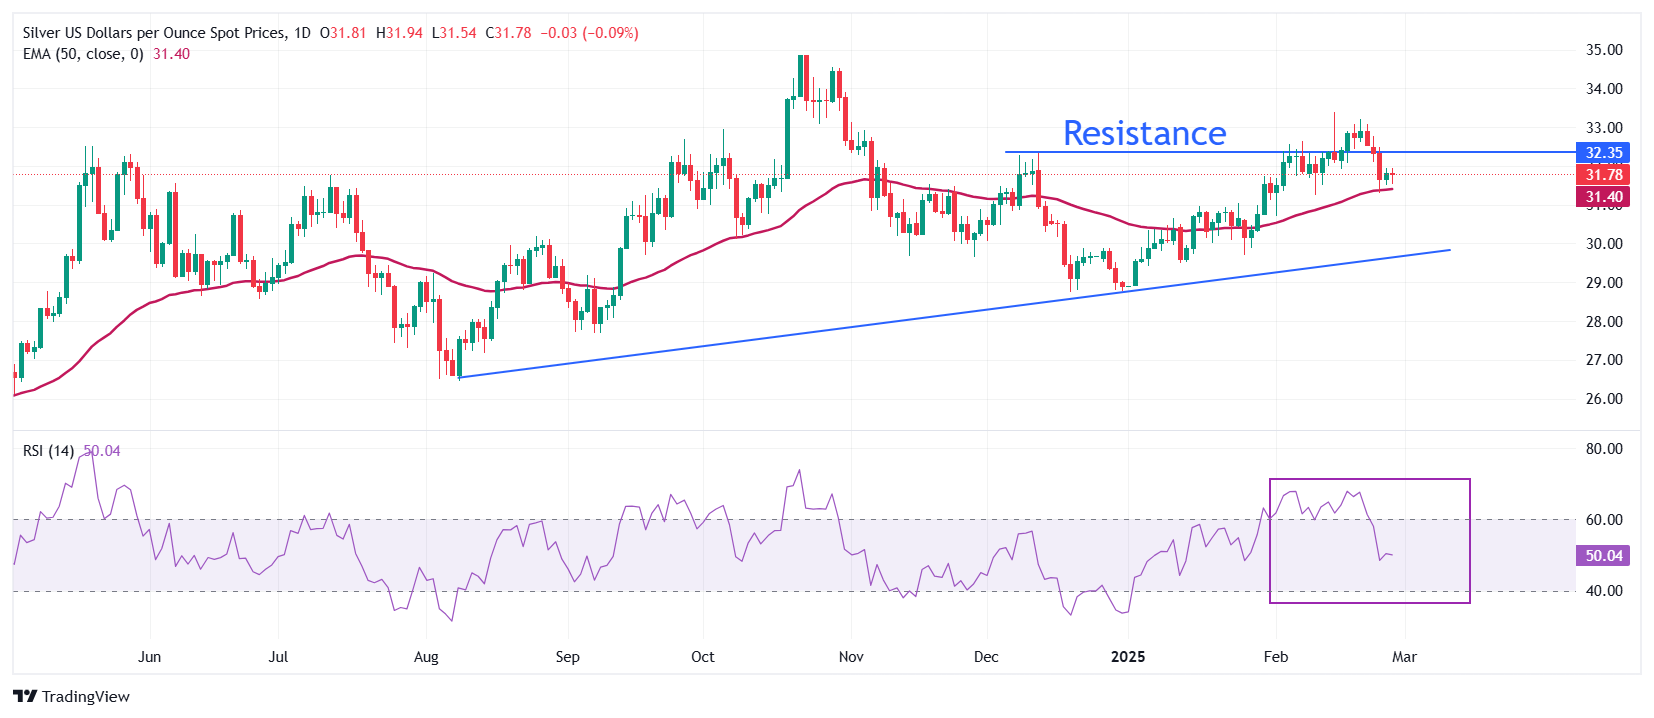
Silver price slides below $32 after failing to sustain above the December 12 high of $32.33. The asset has fallen to near the 50-day Exponential Moving Average (EMA), which trades around $31.40.
The 14-day Relative Strength Index (RSI) falls inside the 40.00-60.00 range, suggesting that the bullish momentum has been faded. However, the bullish bias remains intact.
Looking down, the upward-sloping trendline from the August 8 low of $26.45 will act as key support for the Silver price around $30.00. While, the February 14 high of $33.40 will be the key barrier.
Silver daily chart
Silver FAQs
Silver is a precious metal highly traded among investors. It has been historically used as a store of value and a medium of exchange. Although less popular than Gold, traders may turn to Silver to diversify their investment portfolio, for its intrinsic value or as a potential hedge during high-inflation periods. Investors can buy physical Silver, in coins or in bars, or trade it through vehicles such as Exchange Traded Funds, which track its price on international markets.
Silver prices can move due to a wide range of factors. Geopolitical instability or fears of a deep recession can make Silver price escalate due to its safe-haven status, although to a lesser extent than Gold's. As a yieldless asset, Silver tends to rise with lower interest rates. Its moves also depend on how the US Dollar (USD) behaves as the asset is priced in dollars (XAG/USD). A strong Dollar tends to keep the price of Silver at bay, whereas a weaker Dollar is likely to propel prices up. Other factors such as investment demand, mining supply – Silver is much more abundant than Gold – and recycling rates can also affect prices.
Silver is widely used in industry, particularly in sectors such as electronics or solar energy, as it has one of the highest electric conductivity of all metals – more than Copper and Gold. A surge in demand can increase prices, while a decline tends to lower them. Dynamics in the US, Chinese and Indian economies can also contribute to price swings: for the US and particularly China, their big industrial sectors use Silver in various processes; in India, consumers’ demand for the precious metal for jewellery also plays a key role in setting prices.
Silver prices tend to follow Gold's moves. When Gold prices rise, Silver typically follows suit, as their status as safe-haven assets is similar. The Gold/Silver ratio, which shows the number of ounces of Silver needed to equal the value of one ounce of Gold, may help to determine the relative valuation between both metals. Some investors may consider a high ratio as an indicator that Silver is undervalued, or Gold is overvalued. On the contrary, a low ratio might suggest that Gold is undervalued relative to Silver.
Author

Sagar Dua
FXStreet
Sagar Dua is associated with the financial markets from his college days. Along with pursuing post-graduation in Commerce in 2014, he started his markets training with chart analysis.


