Silver Price Forecast: XAG/USD refreshes five-month high near $34.60 on global trade concerns
- Silver price jumps to near $34.60 as its safe-haven demand improves amid growing concerns over global trade.
- Investors expect that Trump's tariffs will impact economic growth and prompt inflation across the globe.
- The US core PCE inflation data rose at a faster-than-expected pace of 2.8% in February.

Silver price (XAG) posts a fresh five-month high near $34.60 in North American trading hours on Friday. The white metal strengthens as investors turn cautious ahead of April 2, when United States (US) President Donald Trump is scheduled to unveil reciprocal tariffs.
Market participants expect that Trump's tariffs will result in an economic slowdown and boost inflationary pressures in the near term. Such a scenario increases the appeal of safe-haven assets, such as Silver.
However, the US Dollar (USD) slumps as Trump’s tariffs will also weigh on the US economic outlook. Investors expect the impact the tariffs will have on US imports, which would be forced to pass them on to consumers. The US Dollar Index (DXY), which tracks the Greenback’s value against six major currencies, slides to near 104.00.
Meanwhile, hotter-than-expected US core PCE Inflation – which excludes volatile food and energy items – fails to provide support to the US Dollar. The underlying inflation data rose at a faster pace of 2.8% year-on-year compared to estimates and the prior release of 2.7%. Month-on-month core PCE inflation grew by 0.4%, faster than expectations and the former reading of 0.3%.
Accelerating inflationary pressures force the Federal Reserve (Fed) to maintain a restrictive monetary policy stance for a longer period. Higher interest rates by the Fed bode poorly for non-yielding assets, such as Silver.
Silver technical analysis
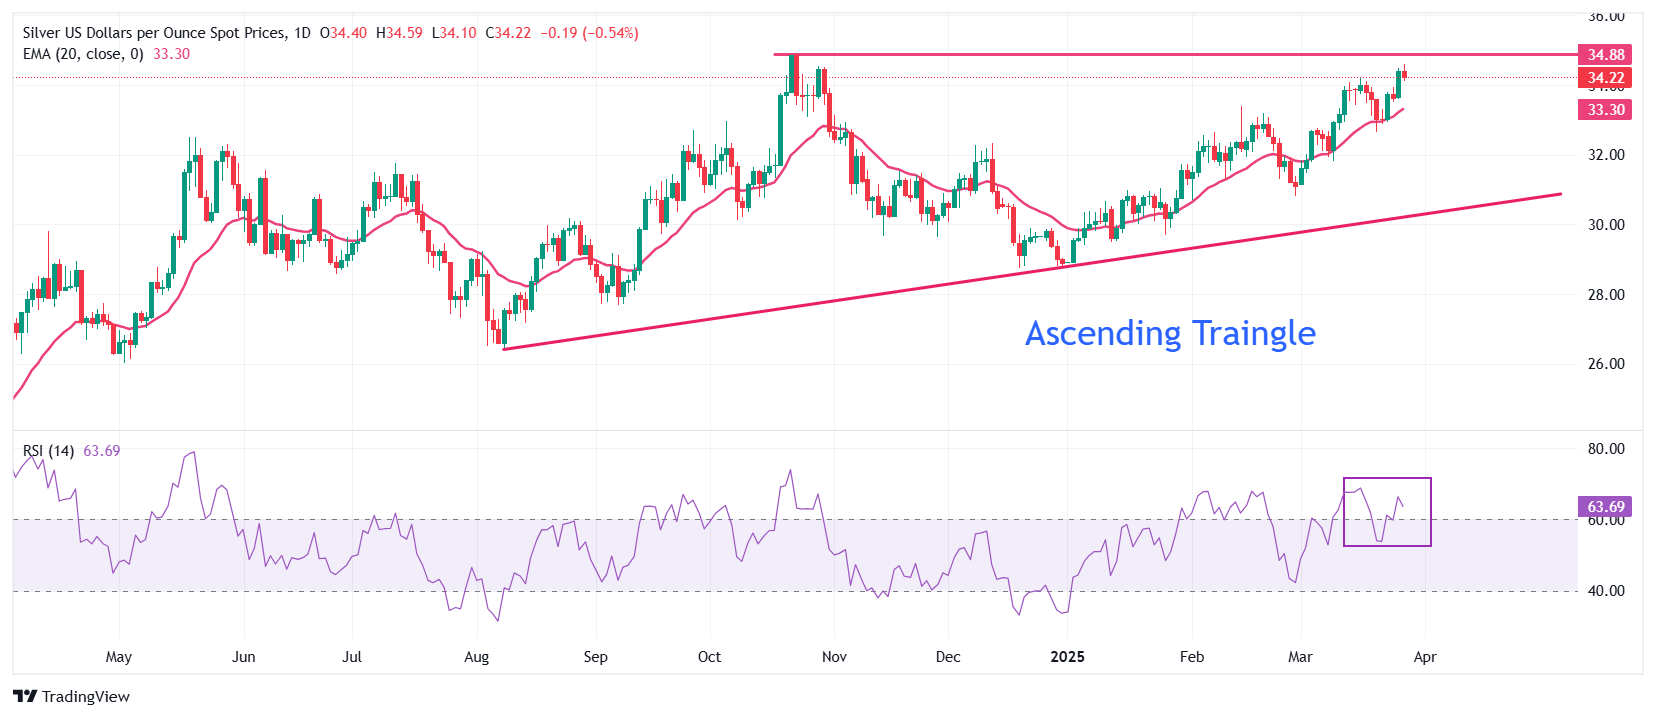
Silver price advances toward the flat border of the Ascending Triangle chart pattern formation on the daily timeframe near the October 22 high of $34.87. The upward-sloping border of the above-mentioned chart pattern is placed from the August 8 low of $26.45. Technically, the Ascending Triangle pattern indicates indecisiveness among market participants.
The 20-day Exponential Moving Average (EMA) near $33.30 continues to provide support to the Silver price.
The 14-day Relative Strength Index (RSI) rebounds above 60.00, suggesting a resurgence in bullish momentum.
Looking down, the March 6 high of $32.77 will act as key support for the Silver price. While, the October 22 high of $34.87 will be the major barrier.
Silver daily chart
Silver FAQs
Silver is a precious metal highly traded among investors. It has been historically used as a store of value and a medium of exchange. Although less popular than Gold, traders may turn to Silver to diversify their investment portfolio, for its intrinsic value or as a potential hedge during high-inflation periods. Investors can buy physical Silver, in coins or in bars, or trade it through vehicles such as Exchange Traded Funds, which track its price on international markets.
Silver prices can move due to a wide range of factors. Geopolitical instability or fears of a deep recession can make Silver price escalate due to its safe-haven status, although to a lesser extent than Gold's. As a yieldless asset, Silver tends to rise with lower interest rates. Its moves also depend on how the US Dollar (USD) behaves as the asset is priced in dollars (XAG/USD). A strong Dollar tends to keep the price of Silver at bay, whereas a weaker Dollar is likely to propel prices up. Other factors such as investment demand, mining supply – Silver is much more abundant than Gold – and recycling rates can also affect prices.
Silver is widely used in industry, particularly in sectors such as electronics or solar energy, as it has one of the highest electric conductivity of all metals – more than Copper and Gold. A surge in demand can increase prices, while a decline tends to lower them. Dynamics in the US, Chinese and Indian economies can also contribute to price swings: for the US and particularly China, their big industrial sectors use Silver in various processes; in India, consumers’ demand for the precious metal for jewellery also plays a key role in setting prices.
Silver prices tend to follow Gold's moves. When Gold prices rise, Silver typically follows suit, as their status as safe-haven assets is similar. The Gold/Silver ratio, which shows the number of ounces of Silver needed to equal the value of one ounce of Gold, may help to determine the relative valuation between both metals. Some investors may consider a high ratio as an indicator that Silver is undervalued, or Gold is overvalued. On the contrary, a low ratio might suggest that Gold is undervalued relative to Silver.
Author

Sagar Dua
FXStreet
Sagar Dua is associated with the financial markets from his college days. Along with pursuing post-graduation in Commerce in 2014, he started his markets training with chart analysis.


