Silver Price Forecast: XAG/USD rebounds as buyers defend key support levels
- Silver prices climb after testing support near $31.90.
- Price action remains range-bound with key levels in focus.
- The potential harami candle on the weekly chart highlights market indecision and softening bearish momentum.

Silver prices are recovering from earlier lows, supported by renewed demand at technical support levels.
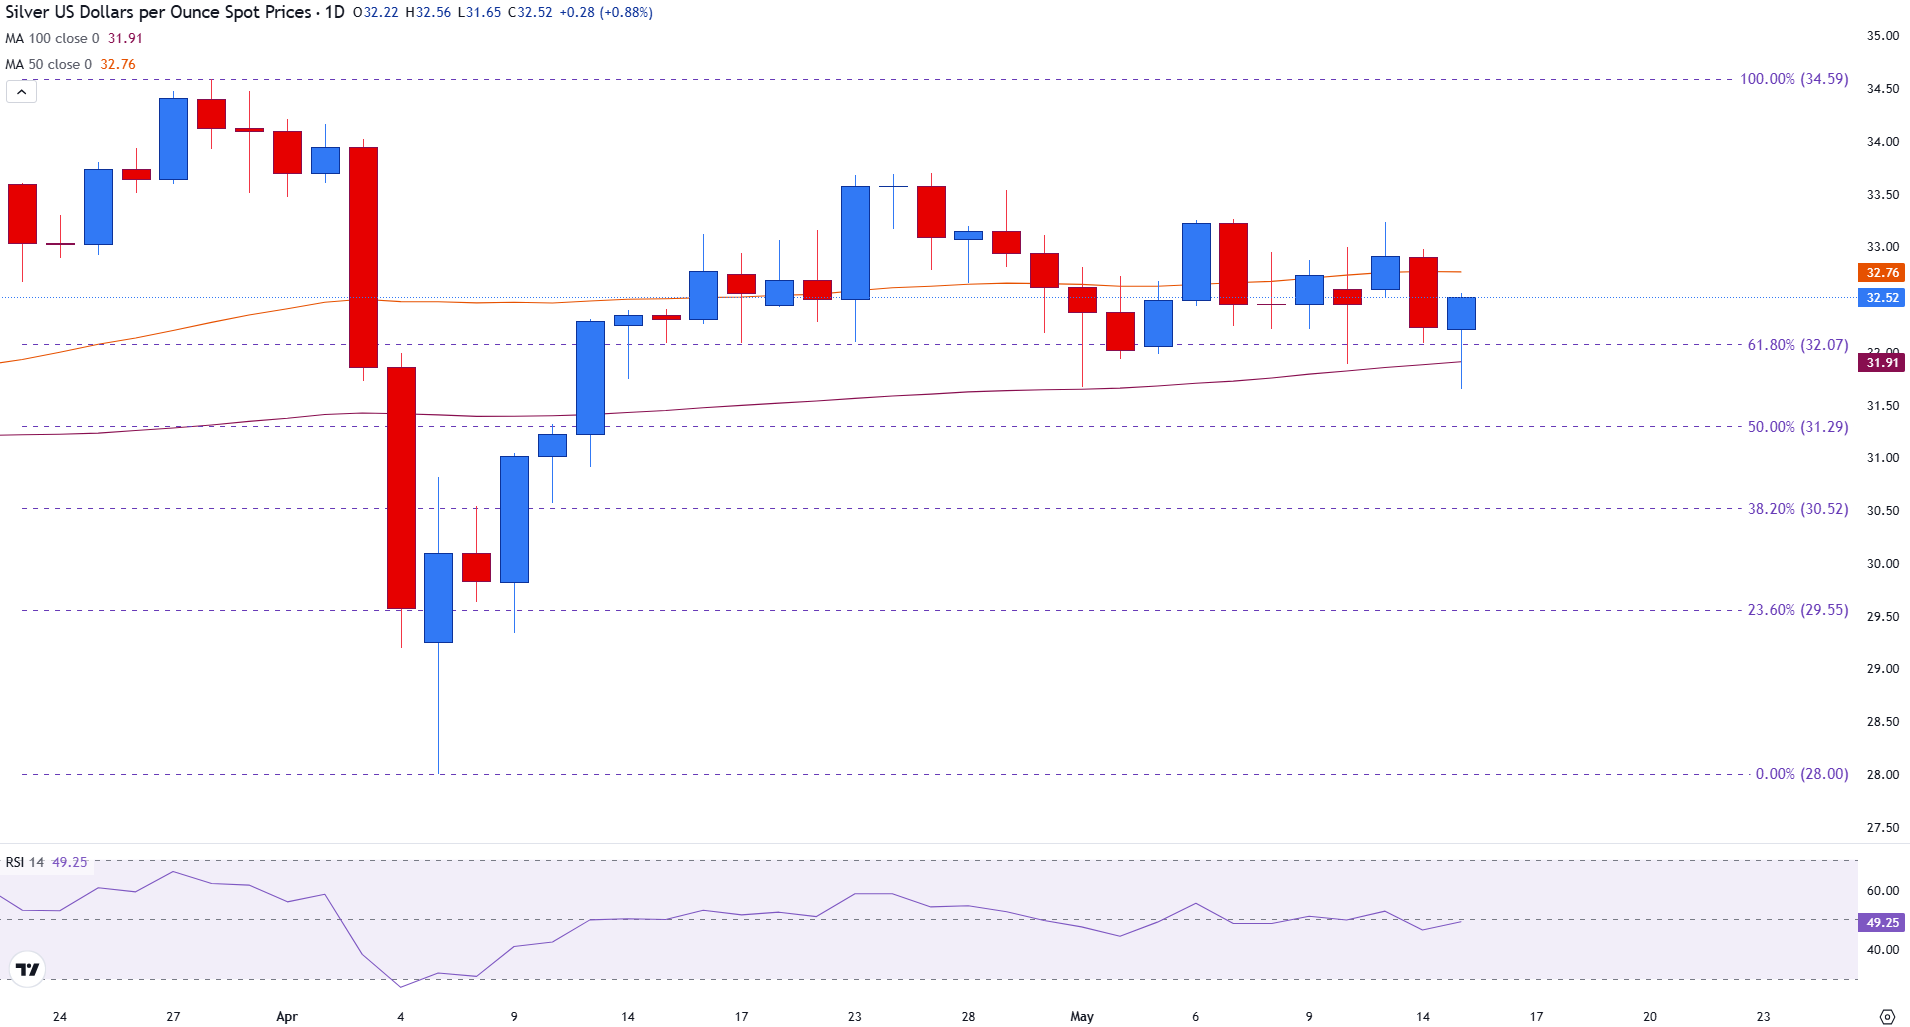
At the time of writing, XAG/USD is up 0.90% on the day, trading near $32.53, after briefly dipping below the 100-day Simple Moving Average (SMA) at $31.90.
The advance reflects increased buying interest, although the broader market remains consolidative. Investors continue to weigh mixed United States (US) economic data and evolving expectations around Federal Reserve (Fed) policy, leaving Silver confined within a well-defined trading range.
Silver bounces off support as buyers regain control
On the daily chart, the current candlestick features a small real body near the top of a long lower wick — a classic sign of intraday bearish pressure that was ultimately rejected.
Buyers stepped in at the 100-day SMA, pushing prices back toward the session’s opening level. While this does not confirm a bullish reversal, it highlights strong demand at lower levels. The candle represents a defensive stance by buyers rather than a clear trend change. However, with the trading day still in progress, a confirmed close is needed to validate the move.
Silver remains constrained between the 100-day SMA at $31.90 and the 50-day SMA at $32.76, with additional resistance at the psychological $33.00 level. Immediate support aligns with the 61.8% Fibonacci retracement of the March–April rally, near the $32.00 mark. The Relative Strength Index (RSI) on the daily chart stands at 47.68, indicating a neutral momentum profile.
Silver (XAG/USD) daily chart
Weekly chart highlights potential shift in momentum
On the weekly timeframe, Silver appears to be forming a bullish harami pattern — a smaller bullish candle developing within the body of last week’s larger bearish candle. This configuration often signals a potential loss of bearish momentum, particularly when it occurs near established support levels. In this case, Silver is holding above the 23.6% Fibonacci retracement of the 2024 advance, located at $31.81.
Silver (XAG/USD) weekly chart

The 10-week and 50-week SMAs, positioned at $32.57 and $30.95, respectively, are gradually converging, indicating a tightening technical structure. The Relative Strength Index (RSI) on the weekly chart is at 52.75, reflecting a mildly bullish bias but no strong momentum either way. A sustained breakout above $33.69 or a confirmed close below $31.80 would likely determine the next directional move for Silver.
Silver FAQs
Silver is a precious metal highly traded among investors. It has been historically used as a store of value and a medium of exchange. Although less popular than Gold, traders may turn to Silver to diversify their investment portfolio, for its intrinsic value or as a potential hedge during high-inflation periods. Investors can buy physical Silver, in coins or in bars, or trade it through vehicles such as Exchange Traded Funds, which track its price on international markets.
Silver prices can move due to a wide range of factors. Geopolitical instability or fears of a deep recession can make Silver price escalate due to its safe-haven status, although to a lesser extent than Gold's. As a yieldless asset, Silver tends to rise with lower interest rates. Its moves also depend on how the US Dollar (USD) behaves as the asset is priced in dollars (XAG/USD). A strong Dollar tends to keep the price of Silver at bay, whereas a weaker Dollar is likely to propel prices up. Other factors such as investment demand, mining supply – Silver is much more abundant than Gold – and recycling rates can also affect prices.
Silver is widely used in industry, particularly in sectors such as electronics or solar energy, as it has one of the highest electric conductivity of all metals – more than Copper and Gold. A surge in demand can increase prices, while a decline tends to lower them. Dynamics in the US, Chinese and Indian economies can also contribute to price swings: for the US and particularly China, their big industrial sectors use Silver in various processes; in India, consumers’ demand for the precious metal for jewellery also plays a key role in setting prices.
Silver prices tend to follow Gold's moves. When Gold prices rise, Silver typically follows suit, as their status as safe-haven assets is similar. The Gold/Silver ratio, which shows the number of ounces of Silver needed to equal the value of one ounce of Gold, may help to determine the relative valuation between both metals. Some investors may consider a high ratio as an indicator that Silver is undervalued, or Gold is overvalued. On the contrary, a low ratio might suggest that Gold is undervalued relative to Silver.
Author

Tammy Da Costa, CFTe®
FXStreet
Tammy is an economist and market analyst with a deep passion for financial markets, particularly commodities and geopolitics.


