Silver Price Forecast: XAG/USD rallies above $33 despite Trump tariff fears ease
- Silver price soars to near $33.30 despite multiple headwinds.
- US Trump didn’t reveal a detailed reciprocal tariff plan on Thursday.
- The Fed is expected to hold interest rates steady in the next three policy meetings.

Silver price (XAG/USD) surges over 2.5% to near $33.30 in Friday’s North American session, the highest level seen in more than three months. The white metal soars even though risks of a global trade war have paused temporarily and the Federal Reserve (Fed) is expected to maintain a restrictive monetary policy stance for longer.
US President Donald Trump seems short of imposing reciprocal tariffs than what market participants had anticipated. Investors had expected that Trump could unveil a detailed plan of reciprocal tariffs on Thursday. The assumption was based on his tweet at his Truth Social account that “Three great weeks, perhaps the best ever, but today is the big one: reciprocal tariffs!!! Make America great again!!!", which came in early North American trading hours on Thursday.
However, Trump only passed an order to the Commerce and Treasury departments to prepare a plan on reciprocity, which confirmed that tariffs are not happening, at least for now.
This scenario diminished fears of global uncertainty, which is technically not favorable for the Silver price.
The impact of a delay in Trump’s reciprocal tariffs is visible on the US Dollar (USD), with the US Dollar Index (DXY) revisiting the four-week low around 106.80.
According to the CME FedWatch tool, the Fed is expected to keep interest rates steady in the next three policy meetings.
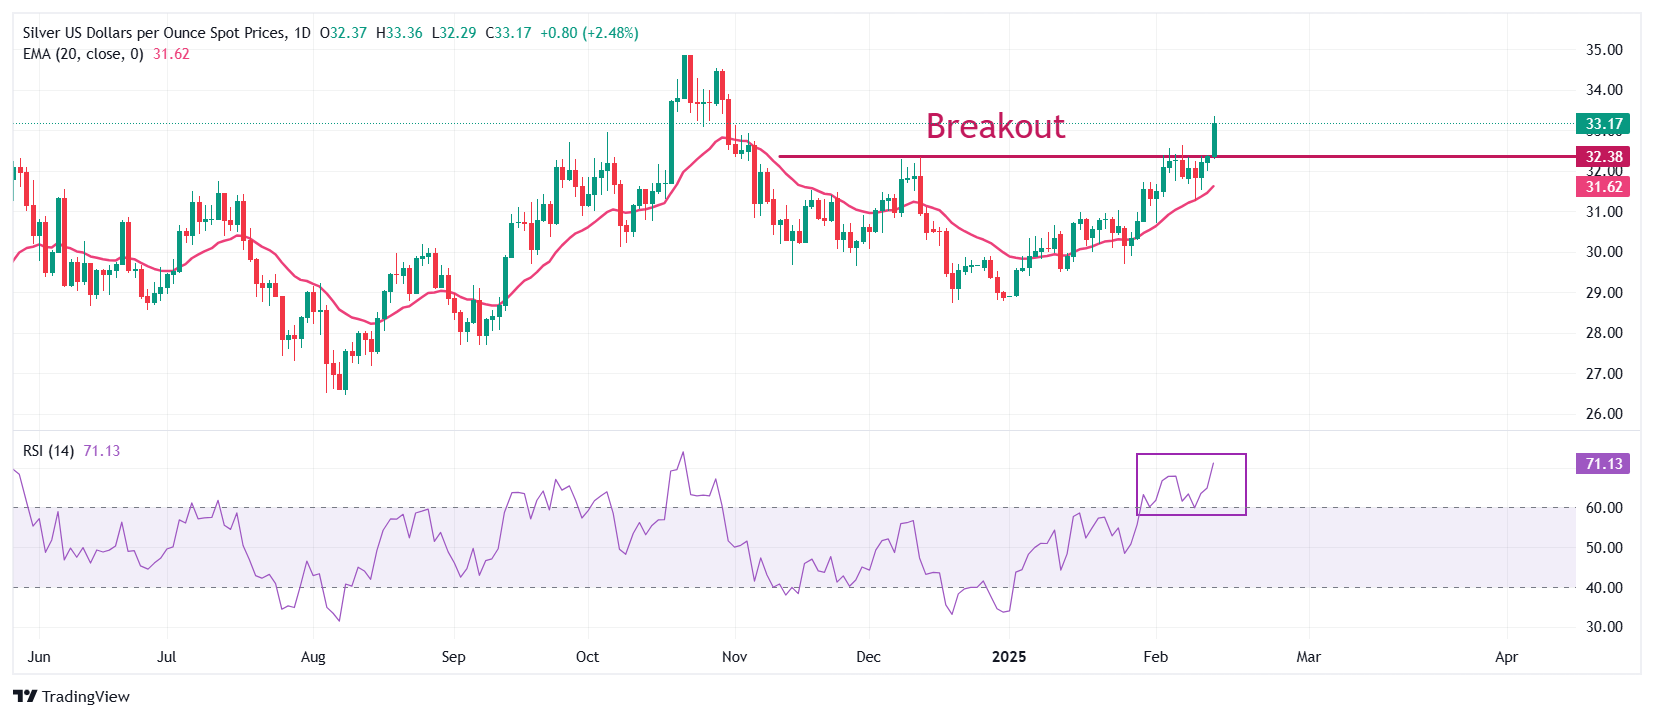
Silver technical analysis
Silver price breaks strongly above the key resistance of $32.50, which is plotted from the December 9 high. The outlook of the white metal was already bullish as the 20-day Exponential Moving Average (EMA) has been sloping higher, which trades around $31.60.
The 14-day Relative Strength Index (RSI) oscillates in the 60.00-80.00 range, suggesting that the momentum is strongly bullish.
Looking down, the December 9 high of $32.50 will be the key support for the Silver price. While, the October 31 high of $33.90 will be the key barrier.
Silver daily chart
Silver FAQs
Silver is a precious metal highly traded among investors. It has been historically used as a store of value and a medium of exchange. Although less popular than Gold, traders may turn to Silver to diversify their investment portfolio, for its intrinsic value or as a potential hedge during high-inflation periods. Investors can buy physical Silver, in coins or in bars, or trade it through vehicles such as Exchange Traded Funds, which track its price on international markets.
Silver prices can move due to a wide range of factors. Geopolitical instability or fears of a deep recession can make Silver price escalate due to its safe-haven status, although to a lesser extent than Gold's. As a yieldless asset, Silver tends to rise with lower interest rates. Its moves also depend on how the US Dollar (USD) behaves as the asset is priced in dollars (XAG/USD). A strong Dollar tends to keep the price of Silver at bay, whereas a weaker Dollar is likely to propel prices up. Other factors such as investment demand, mining supply – Silver is much more abundant than Gold – and recycling rates can also affect prices.
Silver is widely used in industry, particularly in sectors such as electronics or solar energy, as it has one of the highest electric conductivity of all metals – more than Copper and Gold. A surge in demand can increase prices, while a decline tends to lower them. Dynamics in the US, Chinese and Indian economies can also contribute to price swings: for the US and particularly China, their big industrial sectors use Silver in various processes; in India, consumers’ demand for the precious metal for jewellery also plays a key role in setting prices.
Silver prices tend to follow Gold's moves. When Gold prices rise, Silver typically follows suit, as their status as safe-haven assets is similar. The Gold/Silver ratio, which shows the number of ounces of Silver needed to equal the value of one ounce of Gold, may help to determine the relative valuation between both metals. Some investors may consider a high ratio as an indicator that Silver is undervalued, or Gold is overvalued. On the contrary, a low ratio might suggest that Gold is undervalued relative to Silver.
Author

Sagar Dua
FXStreet
Sagar Dua is associated with the financial markets from his college days. Along with pursuing post-graduation in Commerce in 2014, he started his markets training with chart analysis.


