Silver Price Forecast: XAG/USD plummets to near $32 as its safe-haven demand fizzles out
- Silver price plunges to near $32.15 as 90-day US-China trade truce dampens the demand for safe-haven assets.
- Both the US and China agreed to lower tariffs by 115%.
- Investors await Fed Powell’s speech for fresh monetary policy guidance.

Silver price (XAG/USD) is down over 1% to near $32.15 during North American trading hours on Wednesday. The white metal faces a sharp selling pressure as demand for safe-haven assets has fizzled out, with the United States (US) and China aiming to avert a more than a month-long trade war.
On Monday, Washington and Beijing agreed to lower import duties by 115% for 90 days, which reduced tariffs on them to 10% and 30%, respectively, after a two-day meeting in Switzerland. US Treasury Secretary Scott Bessent stated on Tuesday that Washington doesn’t intend to decouple with China but wants to bring medicine, semiconductor, and other strategic industries home.
The white metal outperformed when the world’s two largest powerhouses entered a trade war after Beijing announced counter-tariffs against reciprocal tariffs imposed by US President Donald Trump in April.
Additionally, easing inflationary pressures have also diminished the demand for Silver. The US Consumer Price Index (CPI) data showed on Tuesday that the headline inflation fell to 2.3%, the lowest level seen in over four years.
Going forward, the next trigger for the Silver price will be the Federal Reserve (Fed) Chair Jerome Powell’s speech on Thursday. Investors would like to know whether Powell has turned dovish on the interest rate outlook after soft inflation data and a temporary US-China trade truce.
Silver technical analysis
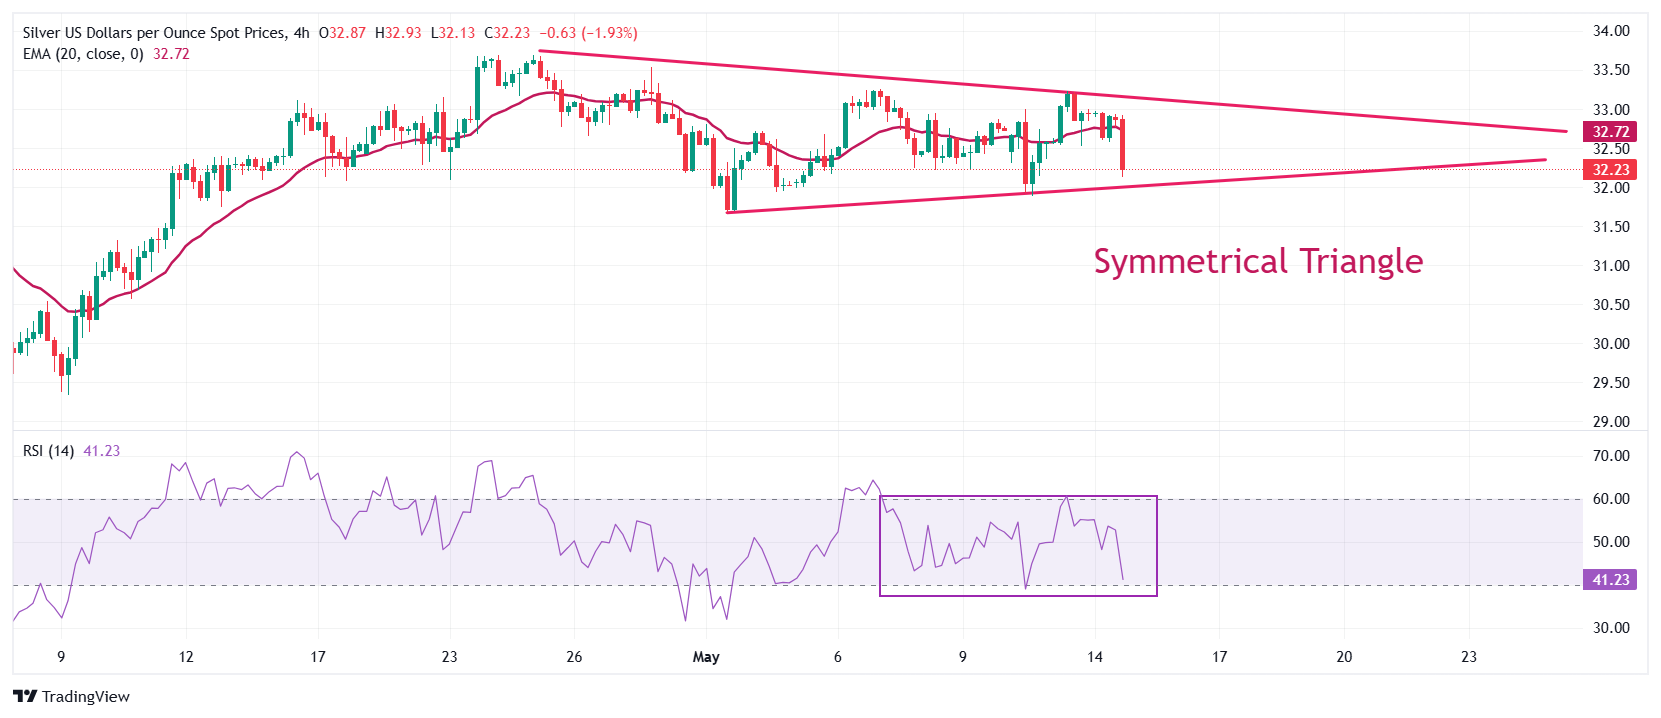
Silver price trades in a Symmetrical Triangle formation on a four-hour timeframe. The chart pattern reflects indecisiveness among market participants. The near-term trend of the white metal is bearish as it trades below the 20-period Exponential Moving Average (EMA), which is around $32.70.
The 14-period Relative Strength Index (RSI) oscillates inside the 40.00-60.00 range, indicating a sharp volatility contraction.
Looking up, the March 28 high of $34.60 will act as key resistance for the metal. On the downside, the April 11 low of $30.90 will be the key support zone.
Silver four-hour chart
Silver FAQs
Silver is a precious metal highly traded among investors. It has been historically used as a store of value and a medium of exchange. Although less popular than Gold, traders may turn to Silver to diversify their investment portfolio, for its intrinsic value or as a potential hedge during high-inflation periods. Investors can buy physical Silver, in coins or in bars, or trade it through vehicles such as Exchange Traded Funds, which track its price on international markets.
Silver prices can move due to a wide range of factors. Geopolitical instability or fears of a deep recession can make Silver price escalate due to its safe-haven status, although to a lesser extent than Gold's. As a yieldless asset, Silver tends to rise with lower interest rates. Its moves also depend on how the US Dollar (USD) behaves as the asset is priced in dollars (XAG/USD). A strong Dollar tends to keep the price of Silver at bay, whereas a weaker Dollar is likely to propel prices up. Other factors such as investment demand, mining supply – Silver is much more abundant than Gold – and recycling rates can also affect prices.
Silver is widely used in industry, particularly in sectors such as electronics or solar energy, as it has one of the highest electric conductivity of all metals – more than Copper and Gold. A surge in demand can increase prices, while a decline tends to lower them. Dynamics in the US, Chinese and Indian economies can also contribute to price swings: for the US and particularly China, their big industrial sectors use Silver in various processes; in India, consumers’ demand for the precious metal for jewellery also plays a key role in setting prices.
Silver prices tend to follow Gold's moves. When Gold prices rise, Silver typically follows suit, as their status as safe-haven assets is similar. The Gold/Silver ratio, which shows the number of ounces of Silver needed to equal the value of one ounce of Gold, may help to determine the relative valuation between both metals. Some investors may consider a high ratio as an indicator that Silver is undervalued, or Gold is overvalued. On the contrary, a low ratio might suggest that Gold is undervalued relative to Silver.
a
Author

Sagar Dua
FXStreet
Sagar Dua is associated with the financial markets from his college days. Along with pursuing post-graduation in Commerce in 2014, he started his markets training with chart analysis.















