Silver Price Forecast: XAG/USD nosedives below $36 on improvement in Sino-US trade relations
- Silver price faces an intense sell-off due to multiple headwinds.
- Stable truce between Israel and Iran, and improving US-China trade relations weakens demand for safe-haven assets.
- Accelerating Fed dovish bets fail to support the Silver price.

Silver price slides over 2% to near $35.85 during European trading hours on Friday. The white metal faces a sharp selling pressure due to improvement in trade relations between the United States (US) and China and no signs of Israel-Iran truce violation.
During the European trading session, a spokesperson from the Chinese Ministry of Commerce confirmed that Beijing has agreed to expedite exports to rare earths to the US, while Washington will revoke non-tariff barriers.
On Thursday, US Commerce Secretary Howard Lutnick also confirmed that China is going to “deliver rare earths to us" and "we'll [Washington] take down our countermeasures", Bloomberg TV reported.
Another reason behind severe weakness in the Silver price is the stability in ceasefire between the two Middle East nations since the announcement on earlier this week. US President Donald Trump announced a truce between Israel and Iran, and urged them not to violate the same.
The scenario of easing geopolitical tensions and global economic uncertainty diminishes the appeal of safe-haven assets, such as Silver.
Meanwhile, an increase in Federal Reserve (Fed) dovish bets due to tensions between Donald Trump and Chair Jerome Powell regarding the monetary policy stance has failed to offer support to the Silver price. Fed dovish bets escalate as investors expect Trump’s preferred Powell’s successor will support his economic agenda.
Theoretically, lower interest rates by the Fed bode well for non-yielding assets, such as Silver.
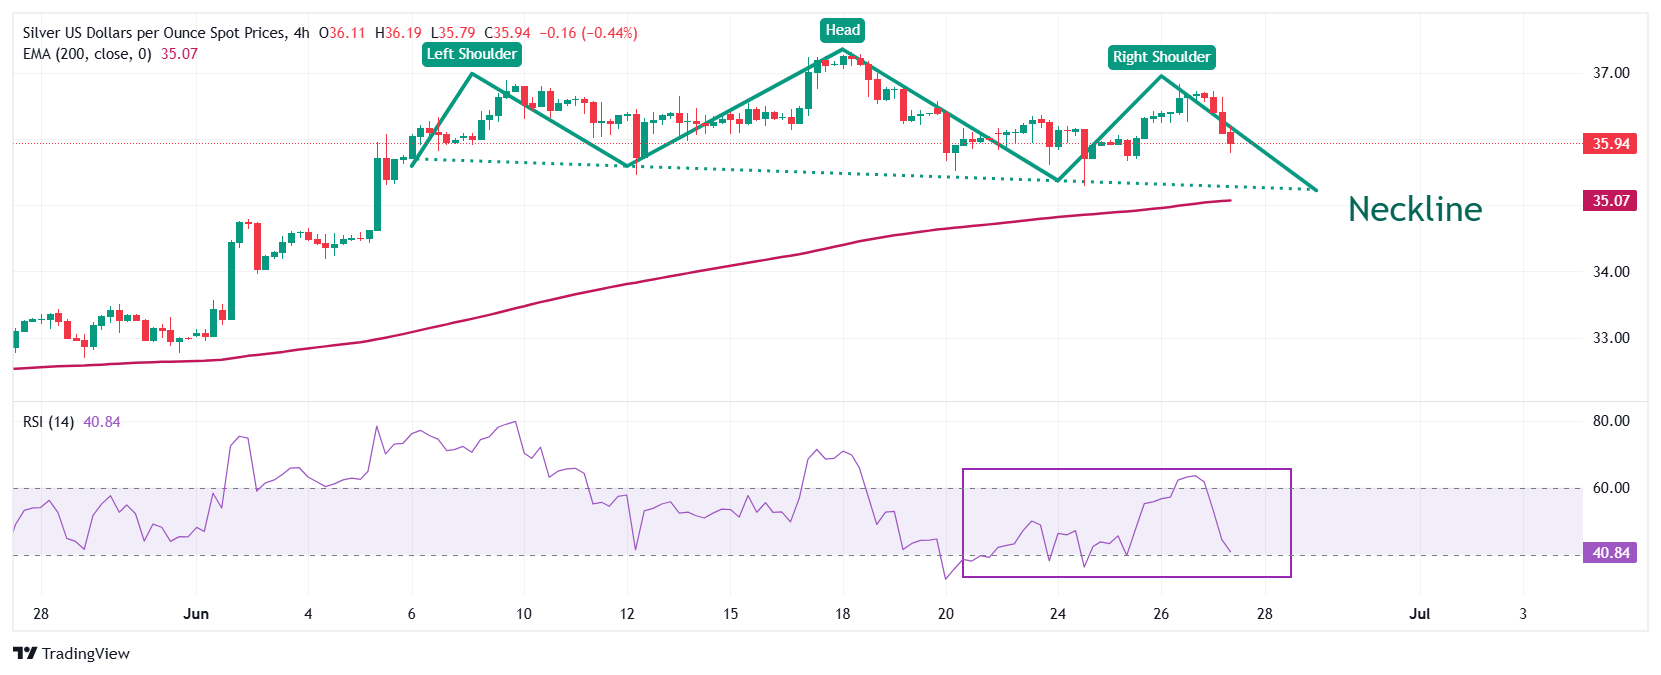
Silver technical analysis
Silver price forms a Head and Shoulder (H&S) chart pattern on a four-timeframe whose breakdown below the neckline results in a bearish reversal. The neckline of the chart pattern is plotted near the Tuesday’s low around $35.28.
The white metal holds above the 200-period Exponential Moving Average (EMA), suggesting that the long-term trend is still bullish.
The 14-period Relative Strength Index (RSI) slides to near 40.00. A fresh bearish momentum would emerge if the RSI fails to hold above that level.
Looking down, the March 28 high around $34.60 will act as key support for the Silver price. On the upside, the fresh over-a-decade high around $37.32 will be the key barrier.
Silver daily chart
Silver FAQs
Silver is a precious metal highly traded among investors. It has been historically used as a store of value and a medium of exchange. Although less popular than Gold, traders may turn to Silver to diversify their investment portfolio, for its intrinsic value or as a potential hedge during high-inflation periods. Investors can buy physical Silver, in coins or in bars, or trade it through vehicles such as Exchange Traded Funds, which track its price on international markets.
Silver prices can move due to a wide range of factors. Geopolitical instability or fears of a deep recession can make Silver price escalate due to its safe-haven status, although to a lesser extent than Gold's. As a yieldless asset, Silver tends to rise with lower interest rates. Its moves also depend on how the US Dollar (USD) behaves as the asset is priced in dollars (XAG/USD). A strong Dollar tends to keep the price of Silver at bay, whereas a weaker Dollar is likely to propel prices up. Other factors such as investment demand, mining supply – Silver is much more abundant than Gold – and recycling rates can also affect prices.
Silver is widely used in industry, particularly in sectors such as electronics or solar energy, as it has one of the highest electric conductivity of all metals – more than Copper and Gold. A surge in demand can increase prices, while a decline tends to lower them. Dynamics in the US, Chinese and Indian economies can also contribute to price swings: for the US and particularly China, their big industrial sectors use Silver in various processes; in India, consumers’ demand for the precious metal for jewellery also plays a key role in setting prices.
Silver prices tend to follow Gold's moves. When Gold prices rise, Silver typically follows suit, as their status as safe-haven assets is similar. The Gold/Silver ratio, which shows the number of ounces of Silver needed to equal the value of one ounce of Gold, may help to determine the relative valuation between both metals. Some investors may consider a high ratio as an indicator that Silver is undervalued, or Gold is overvalued. On the contrary, a low ratio might suggest that Gold is undervalued relative to Silver.
Author

Sagar Dua
FXStreet
Sagar Dua is associated with the financial markets from his college days. Along with pursuing post-graduation in Commerce in 2014, he started his markets training with chart analysis.


