Silver Price Forecast: XAG/USD jumps to near $33 as US-China trade tensions ease
- Silver price climbs to nearly $33.00 as trade tensions between the US and China diminish.
- US President Trump is confident of closing a deal with China.
- Trump has pushed back fears of removing Fed Powell.

Silver price (XAG/USD) trades firmly around $33.00 during North American trading hours on Wednesday. The white metal strengthens as fears of an intense trade war between the United States (US) and China have diminished after President Donald Trump signaled the possibility of a deal with Beijing.
“Discussions with Beijing are going well,” Trump said on Tuesday while addressing reporters at the Oval Office, and showed optimism that both nations will “reach a deal”. Trump added that tariffs on China “would not be as high as 145%, but they wouldn’t be zero”.
Theoretically, easing global economic tensions reduces the appeal of safe-haven assets, like Silver. However, the metal is rising due to its industrial demand. Silver has applications in various industries, such as Electric Vehicles (EV), electronics, power and cables, mining etc.
Financial market participants expect that easing tensions between the world’s two largest powerhouses will favor both economies.
Meanwhile, the intraday corrective move in the US Dollar (USD) has also supported the Silver price. The US Dollar Index (DXY), which tracks the Greenback’s value against six major currencies, surrenders initial gains and falls back to near 99.00.
The USD Index gives up intraday gains even though Donald Trump has pushed back fears of sacking Federal Reserve (Fed) Chair Jerome Powell. Still, he is frustrated with Powell for holding interest rates too restrictive.
Silver technical analysis
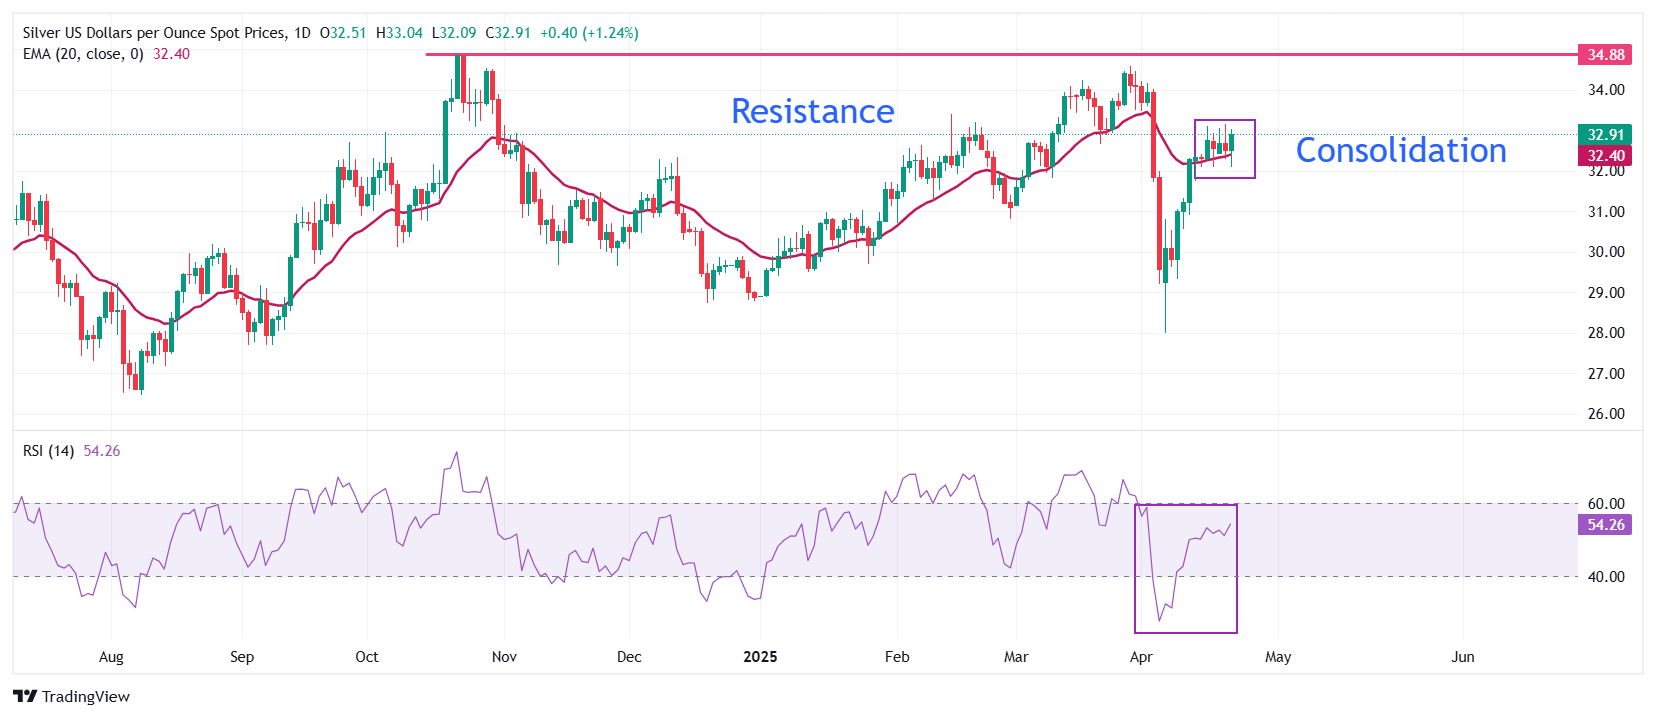
Silver price trades back-and-forth in a range between $32.08 and $33.12 since Wednesday. The white metal turns sideways after a strong upside move since April 7. The 20-day Exponential Moving Average (EMA) near $32.40 continues to provide support to the Silver price.
The 14-day Relative Strength Index (RSI) oscillates in the 40.00-60.00 range, indicating a volatility contraction.
Looking up, the March 28 high of $34.60 will act as key resistance for the metal. On the downside, the April 11 low of $30.90 will be the key support zone.
Silver daily chart
Silver FAQs
Silver is a precious metal highly traded among investors. It has been historically used as a store of value and a medium of exchange. Although less popular than Gold, traders may turn to Silver to diversify their investment portfolio, for its intrinsic value or as a potential hedge during high-inflation periods. Investors can buy physical Silver, in coins or in bars, or trade it through vehicles such as Exchange Traded Funds, which track its price on international markets.
Silver prices can move due to a wide range of factors. Geopolitical instability or fears of a deep recession can make Silver price escalate due to its safe-haven status, although to a lesser extent than Gold's. As a yieldless asset, Silver tends to rise with lower interest rates. Its moves also depend on how the US Dollar (USD) behaves as the asset is priced in dollars (XAG/USD). A strong Dollar tends to keep the price of Silver at bay, whereas a weaker Dollar is likely to propel prices up. Other factors such as investment demand, mining supply – Silver is much more abundant than Gold – and recycling rates can also affect prices.
Silver is widely used in industry, particularly in sectors such as electronics or solar energy, as it has one of the highest electric conductivity of all metals – more than Copper and Gold. A surge in demand can increase prices, while a decline tends to lower them. Dynamics in the US, Chinese and Indian economies can also contribute to price swings: for the US and particularly China, their big industrial sectors use Silver in various processes; in India, consumers’ demand for the precious metal for jewellery also plays a key role in setting prices.
Silver prices tend to follow Gold's moves. When Gold prices rise, Silver typically follows suit, as their status as safe-haven assets is similar. The Gold/Silver ratio, which shows the number of ounces of Silver needed to equal the value of one ounce of Gold, may help to determine the relative valuation between both metals. Some investors may consider a high ratio as an indicator that Silver is undervalued, or Gold is overvalued. On the contrary, a low ratio might suggest that Gold is undervalued relative to Silver.
Author

Sagar Dua
FXStreet
Sagar Dua is associated with the financial markets from his college days. Along with pursuing post-graduation in Commerce in 2014, he started his markets training with chart analysis.


