Silver Price Forecast: XAG/USD holds ground above $47.00 due to prevailing bullish bias
- Silver price may target new all-time highs around the ascending channel’s upper boundary at $48.70.
- The 14-day Relative Strength Index is above 70, indicating that Silver is trading in overbought territory.
- The immediate support appears at the psychological level of $47.00.

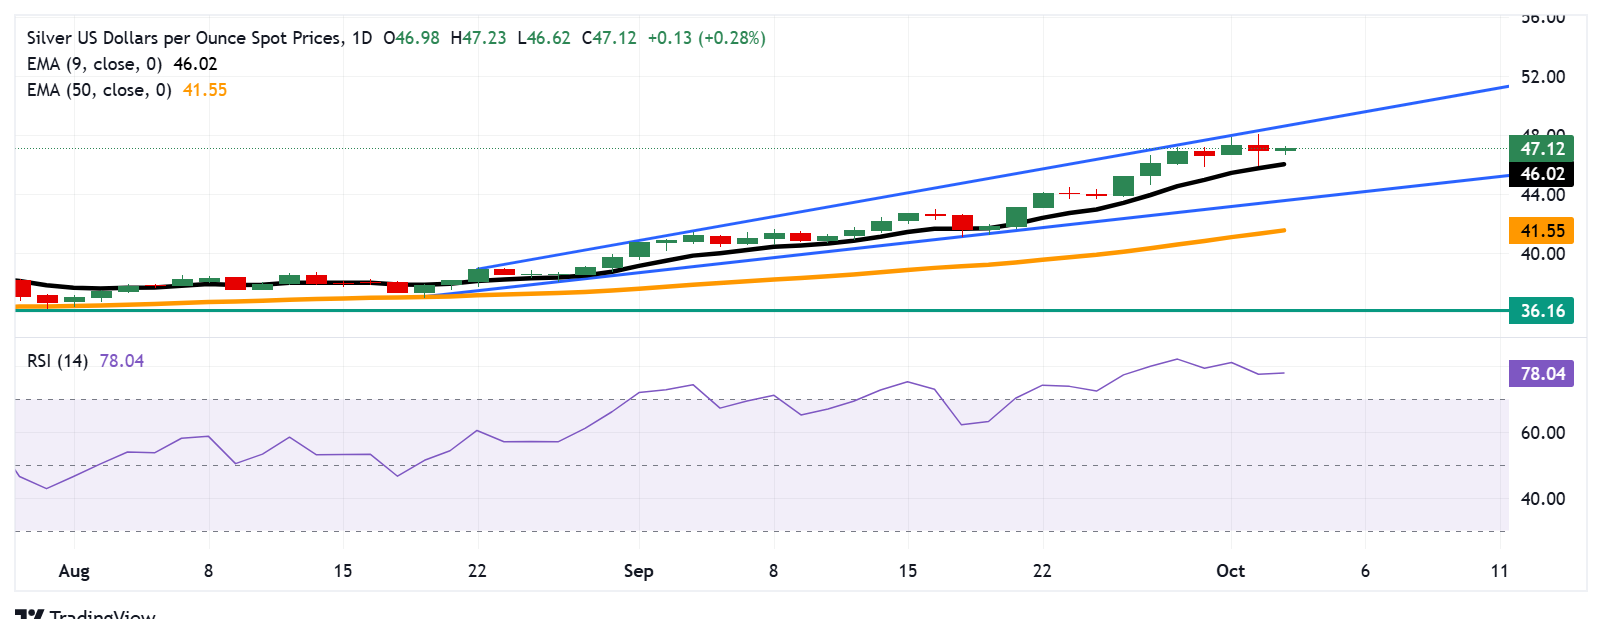
Silver price (XAG/USD) hovers near the new 14-year high of $48.05 reached in the previous session, trading around $47.10 per troy ounce during the Asian hours on Friday. The technical analysis of the daily chart suggests the price of the precious metal moves upwards within an ascending channel pattern, strengthening the bullish bias.
The XAG/USD pair remains above the nine-day Exponential Moving Average (EMA), indicating that short-term price momentum is stronger. However, the 14-day Relative Strength Index (RSI) is positioned above the 70 level, suggesting that the Silver price is trading within overbought territory and a potential for downward corrections.
On the upside, the XAG/USD pair may record fresh all-time highs around the upper boundary of the ascending channel at $48.70. A break above the channel would strengthen the bullish bias and support the pair to approach the psychological level of $50.00.
The initial support lies at the psychological level of $47.00, followed by the nine-day EMA at $46.02. A break below this would weaken the short-term price momentum and prompt the Silver price to test the ascending channel’s lower boundary around $43.70. Further declines below the channel would dampen the bullish bias and put downward pressure on the XAG/USD pair to reach the 50-day EMA of $41.55.
XAG/USD: Daily Chart
Silver FAQs
Silver is a precious metal highly traded among investors. It has been historically used as a store of value and a medium of exchange. Although less popular than Gold, traders may turn to Silver to diversify their investment portfolio, for its intrinsic value or as a potential hedge during high-inflation periods. Investors can buy physical Silver, in coins or in bars, or trade it through vehicles such as Exchange Traded Funds, which track its price on international markets.
Silver prices can move due to a wide range of factors. Geopolitical instability or fears of a deep recession can make Silver price escalate due to its safe-haven status, although to a lesser extent than Gold's. As a yieldless asset, Silver tends to rise with lower interest rates. Its moves also depend on how the US Dollar (USD) behaves as the asset is priced in dollars (XAG/USD). A strong Dollar tends to keep the price of Silver at bay, whereas a weaker Dollar is likely to propel prices up. Other factors such as investment demand, mining supply – Silver is much more abundant than Gold – and recycling rates can also affect prices.
Silver is widely used in industry, particularly in sectors such as electronics or solar energy, as it has one of the highest electric conductivity of all metals – more than Copper and Gold. A surge in demand can increase prices, while a decline tends to lower them. Dynamics in the US, Chinese and Indian economies can also contribute to price swings: for the US and particularly China, their big industrial sectors use Silver in various processes; in India, consumers’ demand for the precious metal for jewellery also plays a key role in setting prices.
Silver prices tend to follow Gold's moves. When Gold prices rise, Silver typically follows suit, as their status as safe-haven assets is similar. The Gold/Silver ratio, which shows the number of ounces of Silver needed to equal the value of one ounce of Gold, may help to determine the relative valuation between both metals. Some investors may consider a high ratio as an indicator that Silver is undervalued, or Gold is overvalued. On the contrary, a low ratio might suggest that Gold is undervalued relative to Silver.
Author

Akhtar Faruqui
FXStreet
Akhtar Faruqui is a Forex Analyst based in New Delhi, India. With a keen eye for market trends and a passion for dissecting complex financial dynamics, he is dedicated to delivering accurate and insightful Forex news and analysis.


