Silver Price Forecast: XAG/USD flat lines below mid-$36.00s; bullish potential seems intact
- Silver lacks any firm intraday direction and seesaws between tepid gains/minor losses on Friday.
- The technical setup favors bullish traders and backs the case for further near-term appreciation.
- A convincing break below the overnight swing low is needed to negate the constructive outlook.

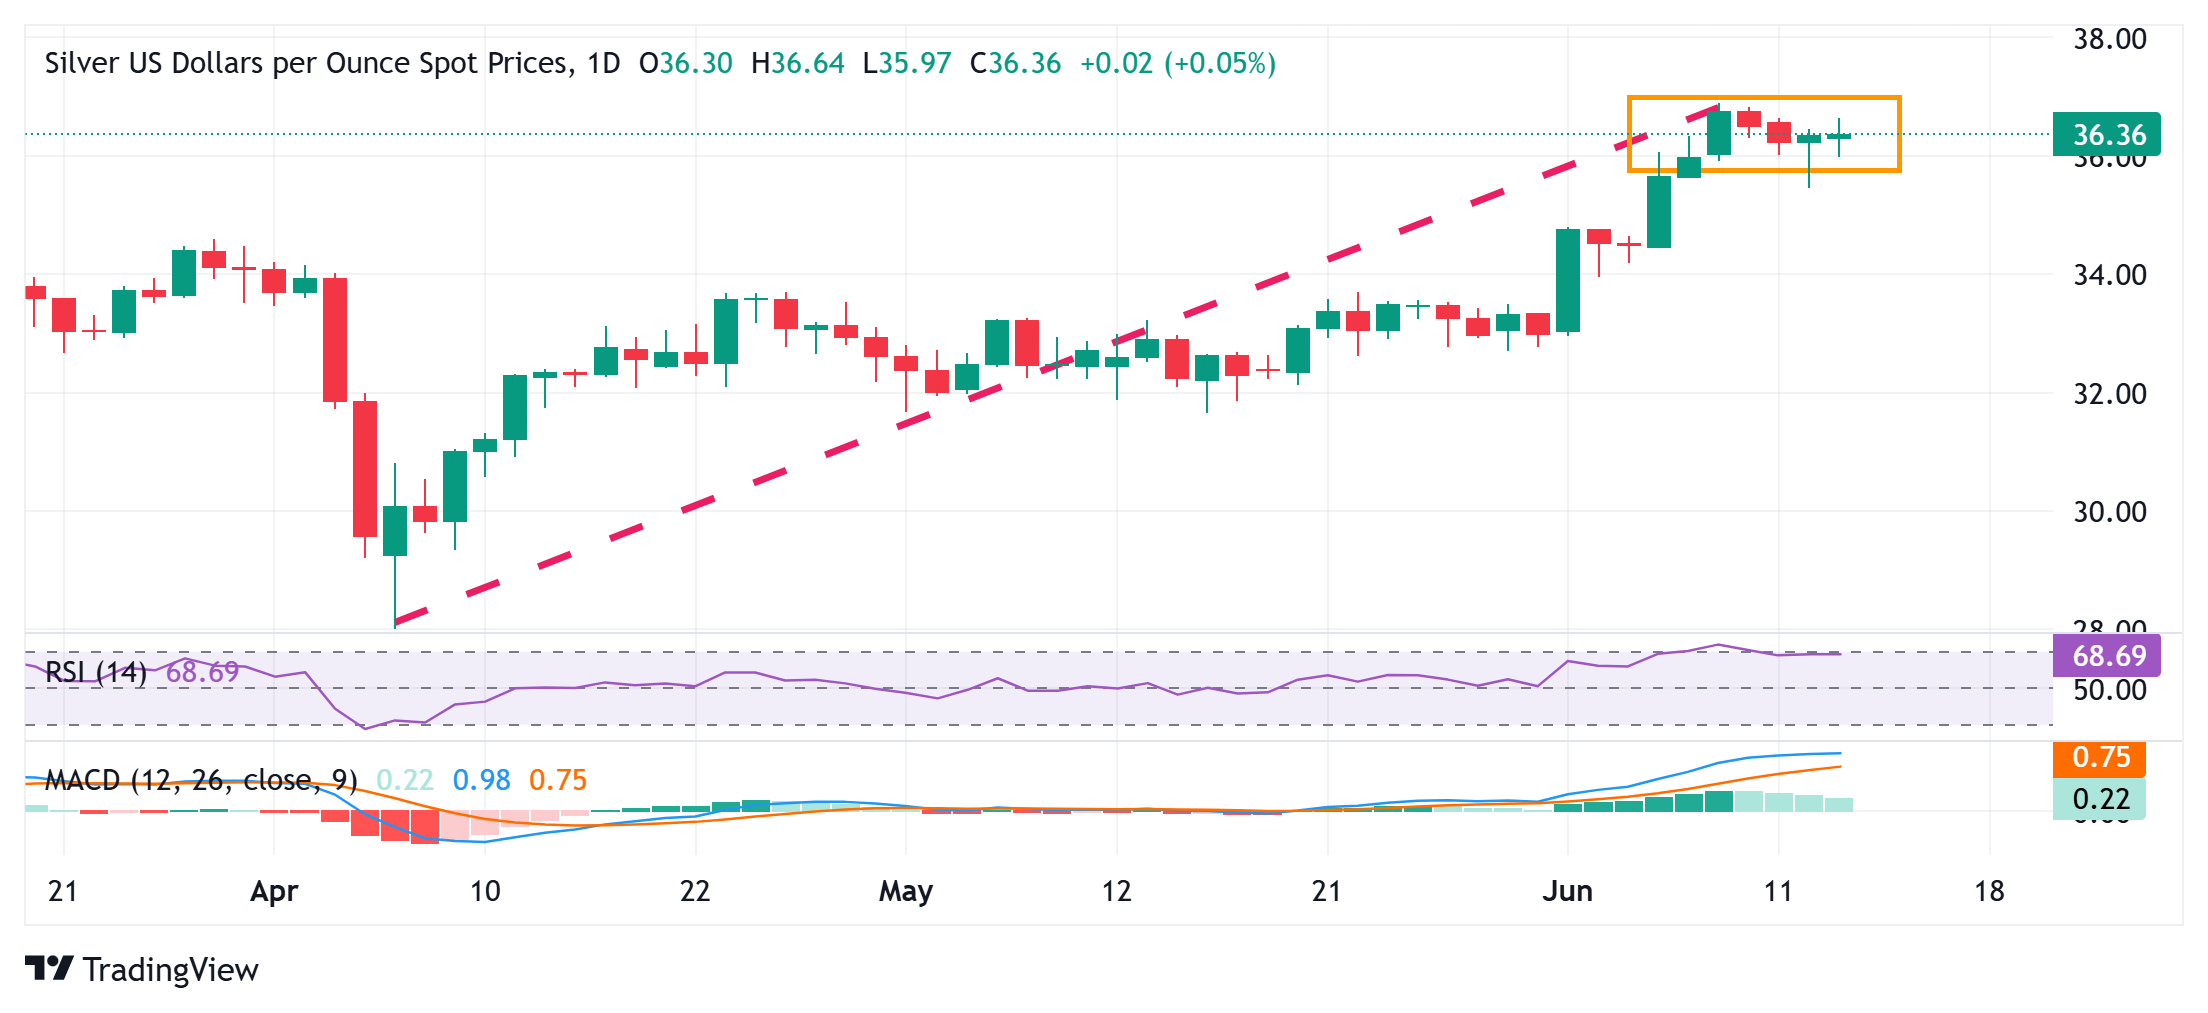
Silver (XAG/USD) struggled to capitalize on the previous day's recovery from the $35.45 area, or the weekly low and witnessed a good two-way price move through the first half of the European session. The white metal now seems to have stabilized in neutral territory, around the $36.30-$36.35 area, and remains within striking distance of its highest level since February 2012 touched on Monday.
From a technical perspective, the range-bound price action witnessed over the past week or so might still be categorized as a bullish consolidation phase against the backdrop of a strong rally from the April monthly swing low. Furthermore, the daily Relative Strength Index (RSI) has eased from slightly overbought conditions. This, along with the lack of any meaningful selling, suggests that the path of least resistance for the XAG/USD is to the upside.
Hence, any corrective pullback below the $36.00 mark, or the daily trough, might continue to attract some dip-buyers near the overnight swing low, around the $35.45 area. A convincing break below the latter, however, might prompt some technical selling and drag the XAG/USD to levels below the $35.00 psychological mark. The corrective pullback could extend further towards the $34.55-$34.50 intermediate support en route to the $34.00 round figure.
Meanwhile, bullish traders might now await a move beyond the multi-year peak, around the $36.85-$36.90 region, before placing fresh bets. The XAG/USD might then extend a well-established short-term uptrend further beyond the $37.00 mark and aim towards testing the February 2012 swing high, around mid-$37.00s.
Silver daily chart
Silver FAQs
Silver is a precious metal highly traded among investors. It has been historically used as a store of value and a medium of exchange. Although less popular than Gold, traders may turn to Silver to diversify their investment portfolio, for its intrinsic value or as a potential hedge during high-inflation periods. Investors can buy physical Silver, in coins or in bars, or trade it through vehicles such as Exchange Traded Funds, which track its price on international markets.
Silver prices can move due to a wide range of factors. Geopolitical instability or fears of a deep recession can make Silver price escalate due to its safe-haven status, although to a lesser extent than Gold's. As a yieldless asset, Silver tends to rise with lower interest rates. Its moves also depend on how the US Dollar (USD) behaves as the asset is priced in dollars (XAG/USD). A strong Dollar tends to keep the price of Silver at bay, whereas a weaker Dollar is likely to propel prices up. Other factors such as investment demand, mining supply – Silver is much more abundant than Gold – and recycling rates can also affect prices.
Silver is widely used in industry, particularly in sectors such as electronics or solar energy, as it has one of the highest electric conductivity of all metals – more than Copper and Gold. A surge in demand can increase prices, while a decline tends to lower them. Dynamics in the US, Chinese and Indian economies can also contribute to price swings: for the US and particularly China, their big industrial sectors use Silver in various processes; in India, consumers’ demand for the precious metal for jewellery also plays a key role in setting prices.
Silver prices tend to follow Gold's moves. When Gold prices rise, Silver typically follows suit, as their status as safe-haven assets is similar. The Gold/Silver ratio, which shows the number of ounces of Silver needed to equal the value of one ounce of Gold, may help to determine the relative valuation between both metals. Some investors may consider a high ratio as an indicator that Silver is undervalued, or Gold is overvalued. On the contrary, a low ratio might suggest that Gold is undervalued relative to Silver.
Author

Haresh Menghani
FXStreet
Haresh Menghani is a detail-oriented professional with 10+ years of extensive experience in analysing the global financial markets.


