Silver Price Forecast: XAG/USD declines to near $29.40 as yields rise after upbeat flash US PMI
- Silver price slumps to near $29.40, weighed down by higher yields.
- Better-than-projected flash US PMI for August uplift bond yields and the US Dollar.
- Going forward, investors will focus on the Fed Powell’s speech at the JH Symposium.

Silver price (XAG/USD) falls sharply to near $29.40 in Thursday’s North American session. The white metal weakens as the US Dollar (USD) rebounds and bond yields rise after better-than-projected preliminary United States (US) S&P Global PMI data for August.
The US Dollar Index (DXY), which tracks the Greenback’s value against six major currencies, bounces back to near 101.45 from a more than seven-month low of 101.00. 10-year US Treasury yields surge to near 3.86%. Higher yields on interest-bearing assets weigh on non-yielding assets, such as Silver, given that they increase the opportunity cost of holding an investment in them.
The flash PMI report showed that the Composite PMI expanded at a faster-than-expected pace to 54.1 but remained below July’s reading of 54.3, driven by upbeat demand in the service sector. While the Manufacturing PMI declined sharply to 48.0. Economists already anticipated activities in manufacturing activities to contract but at a steady pace to 49.6.
Meanwhile, investors await the Federal Reserve (Fed) Chair Jerome Powell’s speech at the Jackson Hole (JH) Symposium, which will start from 14:00 GMT and last to Saturday, at Friday, to get more cues about how deep interest rate cuts will be in September and by the year-end.
The CME FedWatch tool shows that the likelihood of a 50-basis point (bps) interest rate cut is 26.5%. while remaining point to a decline in key borrowing rates by quarter-to-a-point, signaling that traders are sure about the Fed pivoting to policy normalization in September.
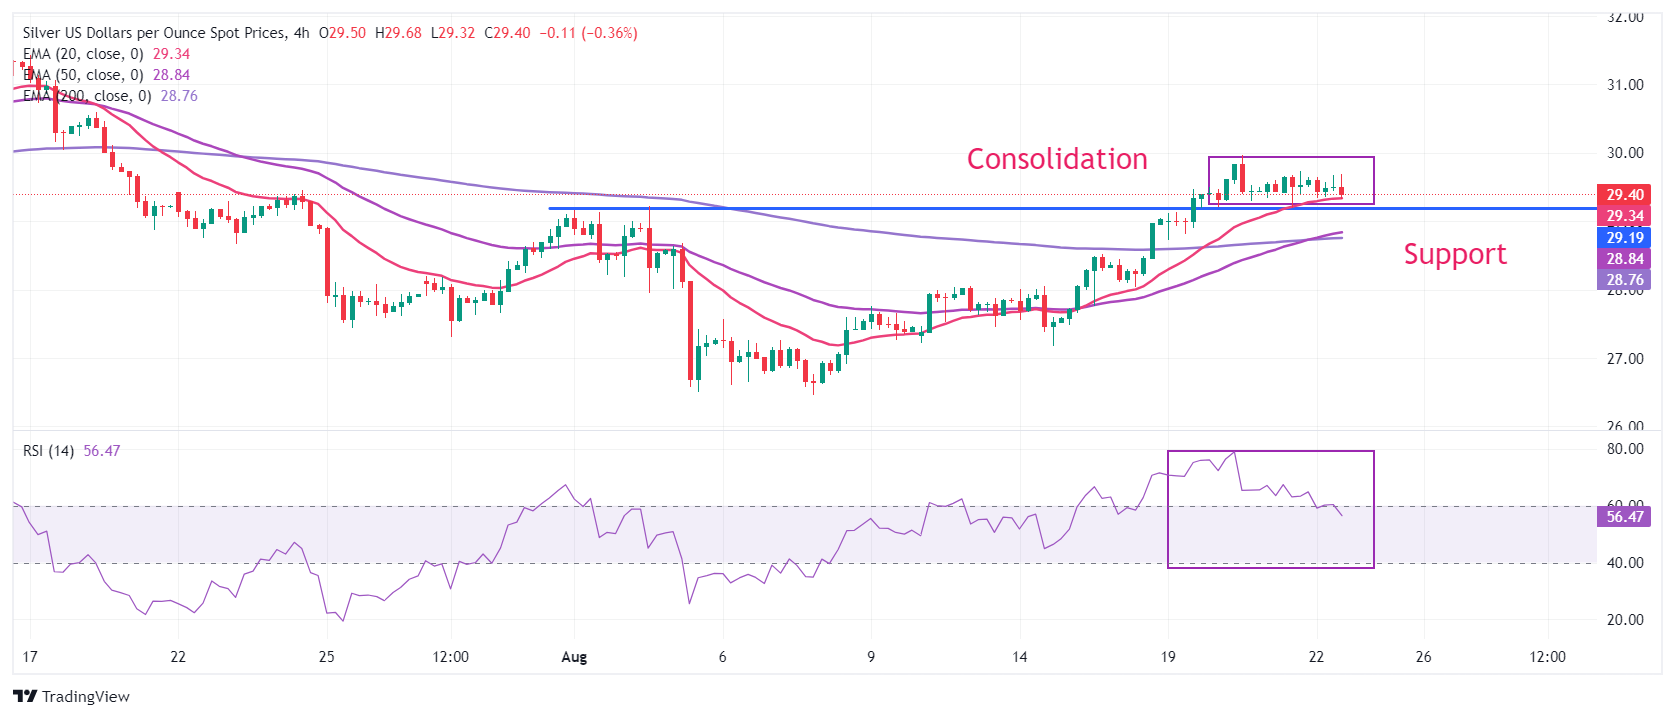
Silver technical analysis
Silver price turns sideways after a decisive break above August 2 high of $29.20, which faltered the lower high lower low formation on a four-hour timeframe. The 20-period Exponential Moving Average (EMA) near $29.20 acts as a cushion for Silver price bulls.
A bull cross, represented by 50 and 200-day EMAs near $28.50, suggests that the overall trend has become strongly bullish.
The 14-period Relative Strength Index (RSI) falls to near 60.00, suggesting that the bullish momentum has concluded for now. However, the bullish bias remains intact.
Silver four-hour chart
Silver FAQs
Silver is a precious metal highly traded among investors. It has been historically used as a store of value and a medium of exchange. Although less popular than Gold, traders may turn to Silver to diversify their investment portfolio, for its intrinsic value or as a potential hedge during high-inflation periods. Investors can buy physical Silver, in coins or in bars, or trade it through vehicles such as Exchange Traded Funds, which track its price on international markets.
Silver prices can move due to a wide range of factors. Geopolitical instability or fears of a deep recession can make Silver price escalate due to its safe-haven status, although to a lesser extent than Gold's. As a yieldless asset, Silver tends to rise with lower interest rates. Its moves also depend on how the US Dollar (USD) behaves as the asset is priced in dollars (XAG/USD). A strong Dollar tends to keep the price of Silver at bay, whereas a weaker Dollar is likely to propel prices up. Other factors such as investment demand, mining supply – Silver is much more abundant than Gold – and recycling rates can also affect prices.
Silver is widely used in industry, particularly in sectors such as electronics or solar energy, as it has one of the highest electric conductivity of all metals – more than Copper and Gold. A surge in demand can increase prices, while a decline tends to lower them. Dynamics in the US, Chinese and Indian economies can also contribute to price swings: for the US and particularly China, their big industrial sectors use Silver in various processes; in India, consumers’ demand for the precious metal for jewellery also plays a key role in setting prices.
Silver prices tend to follow Gold's moves. When Gold prices rise, Silver typically follows suit, as their status as safe-haven assets is similar. The Gold/Silver ratio, which shows the number of ounces of Silver needed to equal the value of one ounce of Gold, may help to determine the relative valuation between both metals. Some investors may consider a high ratio as an indicator that Silver is undervalued, or Gold is overvalued. On the contrary, a low ratio might suggest that Gold is undervalued relative to Silver.
Author

Sagar Dua
FXStreet
Sagar Dua is associated with the financial markets from his college days. Along with pursuing post-graduation in Commerce in 2014, he started his markets training with chart analysis.


