Silver Price Forecast: XAG/USD corrects further to near $35.50 despite escalating Middle East woes
- Silver price retraces sharply from its over-decade high of $36.90 despite Israel-Iran tensions.
- Washington prepares to send letters to its trading partners stating trade proposals as the tariff deadline approaches.
- Silver price fails to capitalize on weak US Dollar.

Silver price (XAG/USD) extends its correction for the third trading day, slides almost 1.5% to near $35.50 during European trading hours on Thursday. The white metal retraces after failing to extend its over-decade high of $36.90 posted on Monday. The asset faces a sharp selling pressure even though tensions in the Middle East have escalated.
According to officials in the United States (US) and Europe, Israel appears to be preparing to launch an attack soon on Iran, The New York Times reported. Meanwhile, Washington has announced that it is scaling back the number of personnel from the Middle East as the tensions between Israel and Iran escalate.
Theoretically, geopolitical tensions increase demand for safe-haven assets, such as Silver.
Meanwhile, increasing uncertainty surrounding the US’s tariff policy has kept the US Dollar (USD) on the backfoot. The White House stated on Wednesday that it is prepared to send a final trade agreement, including tariff rates, to those trading partners from whom Washington has not received any proposal or those who are not negotiating in good faith.
“At a certain point we’re just going to send letters out saying ‘this is the deal,’ you can take it or you can leave it,” Trump wrote in a post on Truth.Social and added, “We’re going to be sending letters out in a week and a half to two weeks telling them what the deal is.”
Technically, lower US Dollar makes the Silver price a value bet for investors.
Silver technical analysis
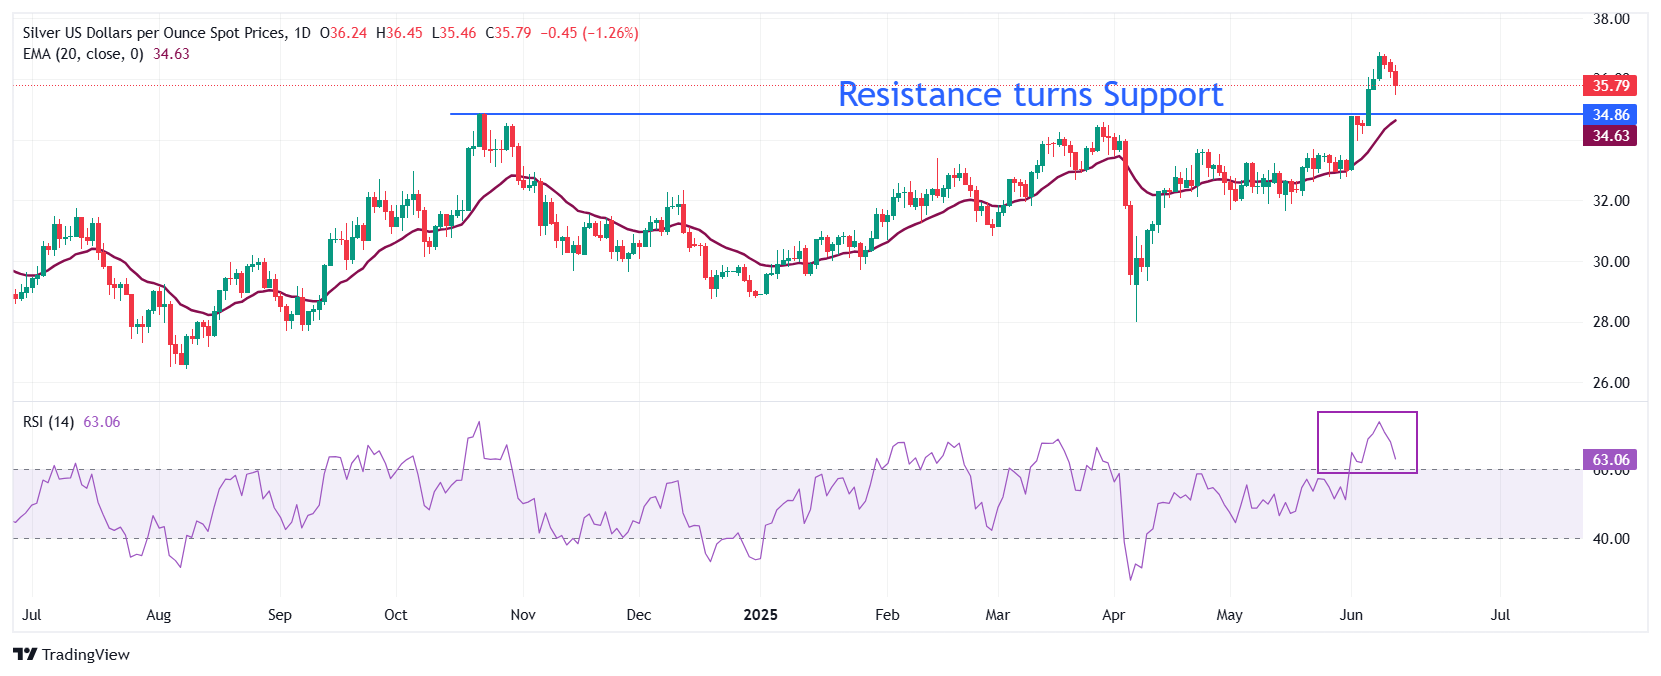
Silver price rally pauses after posting a fresh over-a-decade high around $36.90. However, the near-term outlook of the white metal remains bullish as the 20-day Exponential Moving Average (EMA) slopes higher, which is currently around $34.63.
The 14-day Relative Strength Index (RSI) retraces to near 60.00 after turning overbought. The odds are in favor that the RSI will resume the upside, assuming that the near-term trend is bullish.
Looking up, the psychological level of $40.00 will be the major resistance for the Silver price. On the downside, the October 22 high of $34.87 will act as key support for the asset.
Silver daily chart
,
Silver FAQs
Silver is a precious metal highly traded among investors. It has been historically used as a store of value and a medium of exchange. Although less popular than Gold, traders may turn to Silver to diversify their investment portfolio, for its intrinsic value or as a potential hedge during high-inflation periods. Investors can buy physical Silver, in coins or in bars, or trade it through vehicles such as Exchange Traded Funds, which track its price on international markets.
Silver prices can move due to a wide range of factors. Geopolitical instability or fears of a deep recession can make Silver price escalate due to its safe-haven status, although to a lesser extent than Gold's. As a yieldless asset, Silver tends to rise with lower interest rates. Its moves also depend on how the US Dollar (USD) behaves as the asset is priced in dollars (XAG/USD). A strong Dollar tends to keep the price of Silver at bay, whereas a weaker Dollar is likely to propel prices up. Other factors such as investment demand, mining supply – Silver is much more abundant than Gold – and recycling rates can also affect prices.
Silver is widely used in industry, particularly in sectors such as electronics or solar energy, as it has one of the highest electric conductivity of all metals – more than Copper and Gold. A surge in demand can increase prices, while a decline tends to lower them. Dynamics in the US, Chinese and Indian economies can also contribute to price swings: for the US and particularly China, their big industrial sectors use Silver in various processes; in India, consumers’ demand for the precious metal for jewellery also plays a key role in setting prices.
Silver prices tend to follow Gold's moves. When Gold prices rise, Silver typically follows suit, as their status as safe-haven assets is similar. The Gold/Silver ratio, which shows the number of ounces of Silver needed to equal the value of one ounce of Gold, may help to determine the relative valuation between both metals. Some investors may consider a high ratio as an indicator that Silver is undervalued, or Gold is overvalued. On the contrary, a low ratio might suggest that Gold is undervalued relative to Silver.
Author

Sagar Dua
FXStreet
Sagar Dua is associated with the financial markets from his college days. Along with pursuing post-graduation in Commerce in 2014, he started his markets training with chart analysis.


