Silver Price Forecast: XAG/USD climbs for second day, eyes breakout above triangle barrier
- Silver extends its rebound for the second straight day, trading near $38.00 after bouncing from $37.50 during the European session.
- XAG/USD trades within a symmetrical triangle, with immediate resistance at $38.20 and key support at $37.50.
- Market focus shifts to Fed Chair Jerome Powell’s speech at Jackson Hole on Friday.

Silver (XAG/USD) extends its rebound for a second consecutive day on Thursday, although upside could be limited by a stronger US Dollar (USD) and firm Treasury yields. At the time of writing, the metal is trading around $38.20, recovering from an intraday low near $37.50 touched during the European session.
The US Dollar Index (DXY) climbs to a fresh one-week high near 98.50 after upbeat S&P Purchasing Managers Index (PMI) data reinforces optimism about the growth outlook. At the same time, weekly labor data shows US Initial Jobless Claims rising to an eight-week high, adding to signs of a cooling labor market. The mixed data prompts traders to scale back expectations for aggressive Fed easing, with the CME FedWatch Tool showing a 75% probability of a September rate cut, down from 81% earlier in the day. Market focus now shifts to Fed Chair Jerome Powell’s speech at the Jackson Hole Symposium on Friday, which may provide clarity on the policy outlook.
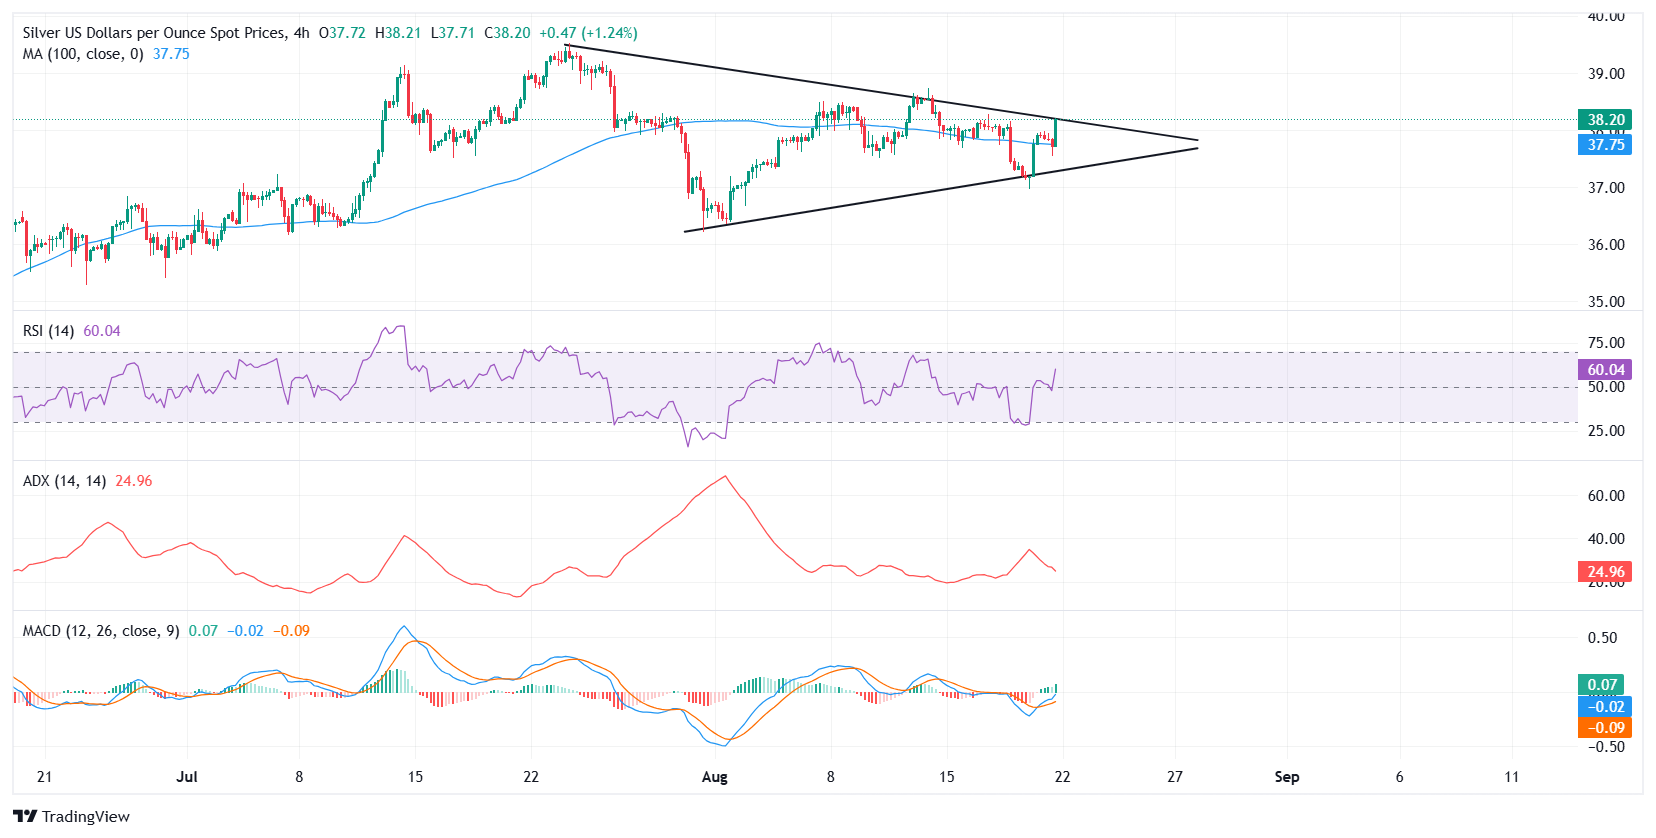
From a technical standpoint, Silver trades within a symmetrical triangle formation on the 4-hour chart. The bounce off the $37.50 support brings prices back above the 100-period Simple Moving Average (SMA) at $37.75, which now acts as immediate support.
A sustained move above the $38.20 psychological barrier, aligned with the triangle’s upper boundary, could trigger a bullish breakout and expose the next resistance levels at $38.74 (August 14 high) and $39.53 (multi-year peak).
Momentum signals show signs of improvement. The Relative Strength Index (RSI) has risen to 59, pointing to strengthening bullish momentum. The Moving Average Convergence Divergence (MACD) has crossed into positive territory, reinforcing the case for a near-term upside bias. Meanwhile, the Average Directional Index (ADX) stands at 24.96, indicating that overall trend strength remains moderate but is gradually improving.
On the downside, failure to clear $38.20 may keep XAG/USD range-bound. Immediate support lies at the 100-SMA, followed by $37.50 and the key $37.00 level. A break below would risk a bearish breakdown toward $36.50.
Silver FAQs
Silver is a precious metal highly traded among investors. It has been historically used as a store of value and a medium of exchange. Although less popular than Gold, traders may turn to Silver to diversify their investment portfolio, for its intrinsic value or as a potential hedge during high-inflation periods. Investors can buy physical Silver, in coins or in bars, or trade it through vehicles such as Exchange Traded Funds, which track its price on international markets.
Silver prices can move due to a wide range of factors. Geopolitical instability or fears of a deep recession can make Silver price escalate due to its safe-haven status, although to a lesser extent than Gold's. As a yieldless asset, Silver tends to rise with lower interest rates. Its moves also depend on how the US Dollar (USD) behaves as the asset is priced in dollars (XAG/USD). A strong Dollar tends to keep the price of Silver at bay, whereas a weaker Dollar is likely to propel prices up. Other factors such as investment demand, mining supply – Silver is much more abundant than Gold – and recycling rates can also affect prices.
Silver is widely used in industry, particularly in sectors such as electronics or solar energy, as it has one of the highest electric conductivity of all metals – more than Copper and Gold. A surge in demand can increase prices, while a decline tends to lower them. Dynamics in the US, Chinese and Indian economies can also contribute to price swings: for the US and particularly China, their big industrial sectors use Silver in various processes; in India, consumers’ demand for the precious metal for jewellery also plays a key role in setting prices.
Silver prices tend to follow Gold's moves. When Gold prices rise, Silver typically follows suit, as their status as safe-haven assets is similar. The Gold/Silver ratio, which shows the number of ounces of Silver needed to equal the value of one ounce of Gold, may help to determine the relative valuation between both metals. Some investors may consider a high ratio as an indicator that Silver is undervalued, or Gold is overvalued. On the contrary, a low ratio might suggest that Gold is undervalued relative to Silver.
Author

Vishal Chaturvedi
FXStreet
I am a macro-focused research analyst with over four years of experience covering forex and commodities market. I enjoy breaking down complex economic trends and turning them into clear, actionable insights that help traders stay ahead of the curve.


