Silver Price Forecast: XAG/USD bulls seem reluctant below $37.00; downside remains limited
- Silver consolidates just below its highest level in more than two weeks set on Thursday.
- The mixed technical setup warrants some caution before placing fresh directional bets.
- Any corrective slide might still be seen as a buying opportunity and remain cushioned.

Silver (XAG/USD) holds steady below the $37.00 mark during the Asian session on Friday and remains within striking distance of over a two-week high touched the previous day. Meanwhile, the constructive technical setup suggests that the path of least resistance for the white metal remains to the upside.
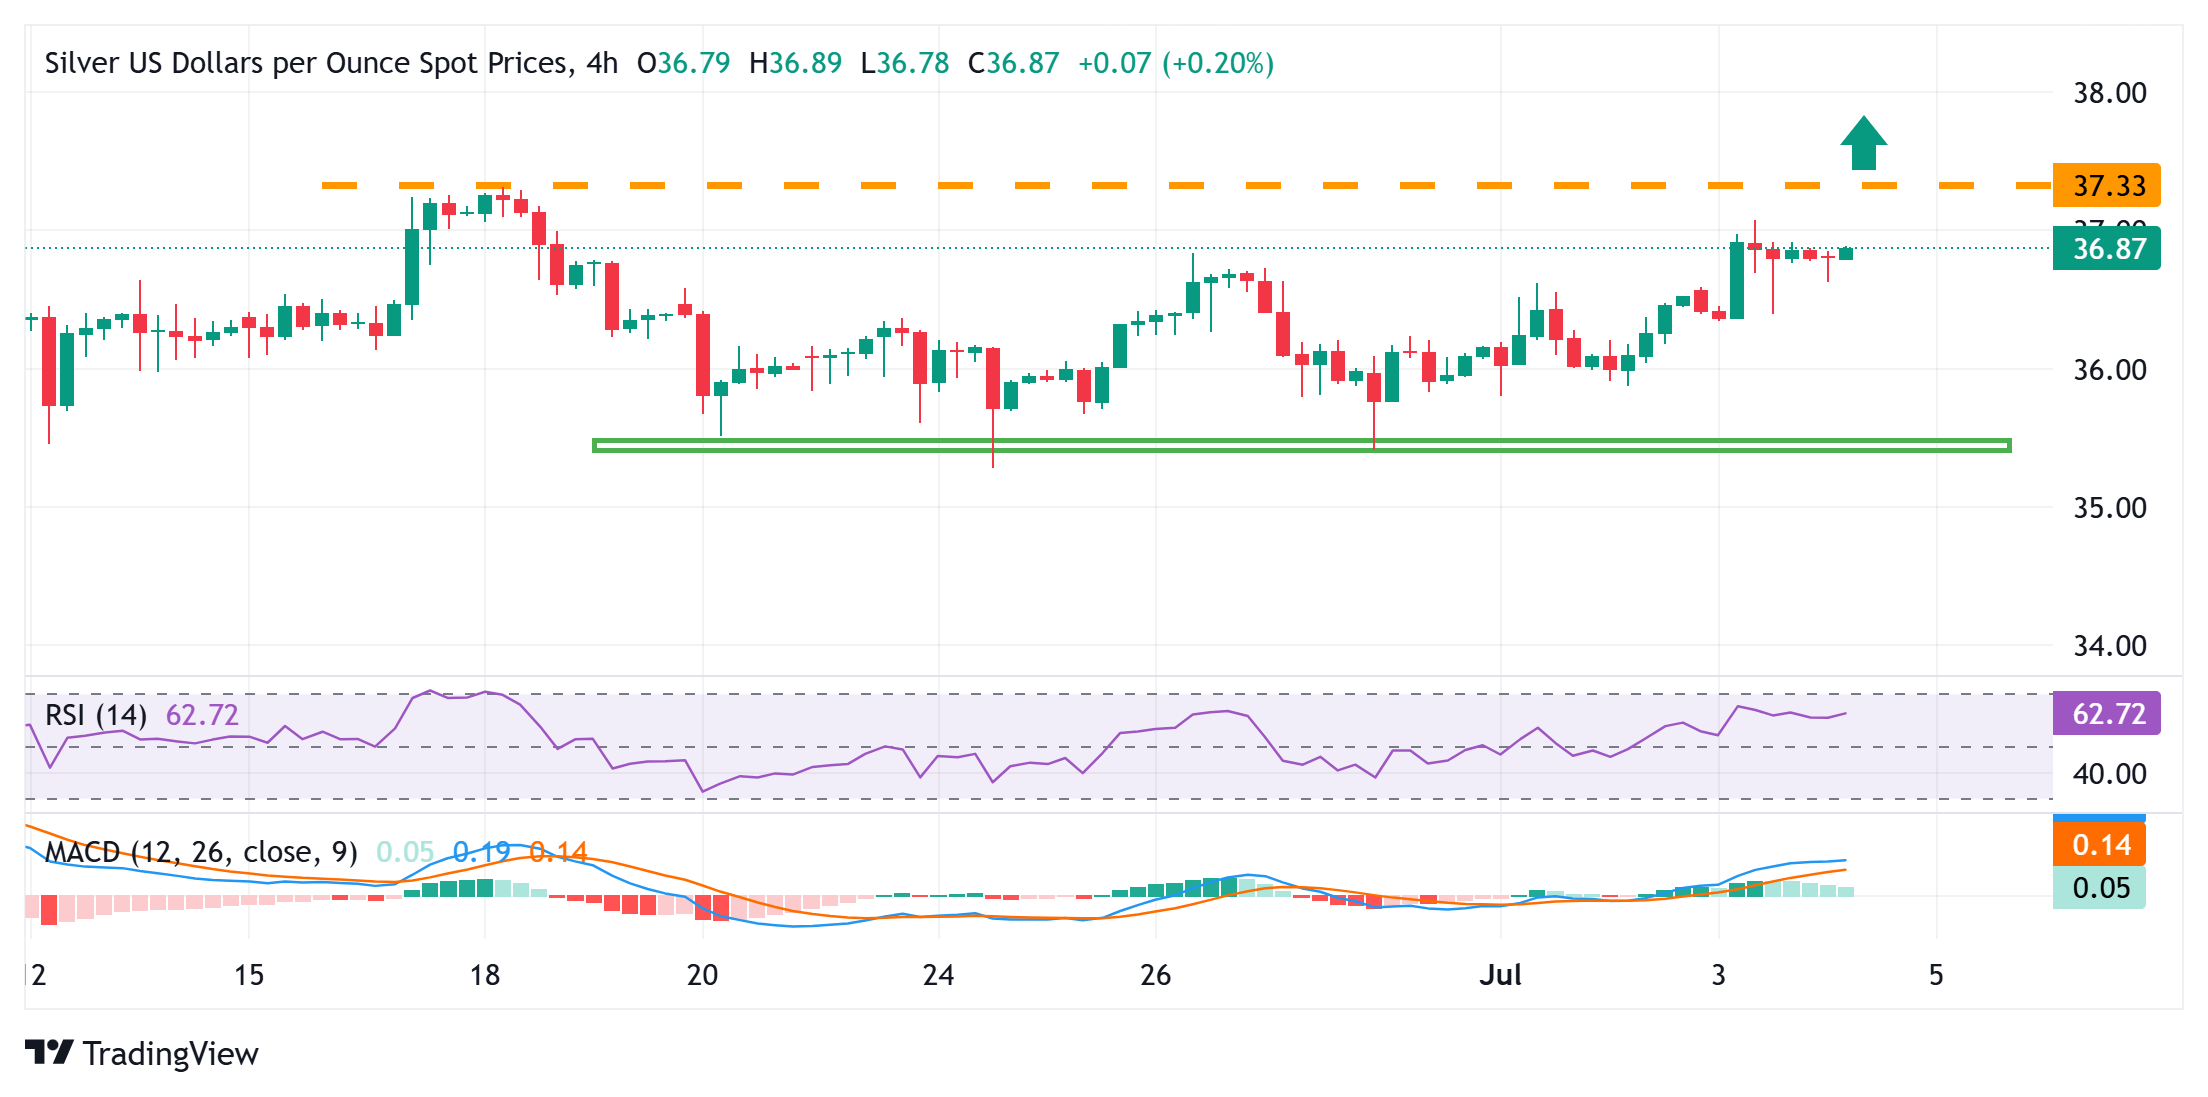
The daily Relative Strength Index (RSI, 14) remains above 50 and validates the positive outlook for the XAG/USD. However, the Moving Average Convergence Divergence (MACD) histogram and the signal line on the daily chart are yet to confirm bullish bias, suggesting that any subsequent move up could stall near the $37.30-$37.35 region, or the highest level since February 2012 touched earlier this month. Some follow-through buying, however, would set the stage for an extension of a nearly three-month-old uptrend.
On the flip side, the $36.50-$36.45 area now seems to protect the immediate downside, below which the XAG/USD could slide to the $36.15-$36.10 region. A further decline below the $36.00 mark could extend towards the $35.50-$35.40 horizontal zone. The latter should act as a key pivotal point and a convincing break below would shift the near-term bias back in favor of bearish traders. The white metal might then accelerate the corrective fall towards the next relevant support near the $35.00 psychological mark.
Some follow-through selling below the latter should pave the way for deeper losses and drag the XAG/USD to an intermediate support near the $34.75 en route to the $34.45 region.
Silver 4-hour chart
Silver FAQs
Silver is a precious metal highly traded among investors. It has been historically used as a store of value and a medium of exchange. Although less popular than Gold, traders may turn to Silver to diversify their investment portfolio, for its intrinsic value or as a potential hedge during high-inflation periods. Investors can buy physical Silver, in coins or in bars, or trade it through vehicles such as Exchange Traded Funds, which track its price on international markets.
Silver prices can move due to a wide range of factors. Geopolitical instability or fears of a deep recession can make Silver price escalate due to its safe-haven status, although to a lesser extent than Gold's. As a yieldless asset, Silver tends to rise with lower interest rates. Its moves also depend on how the US Dollar (USD) behaves as the asset is priced in dollars (XAG/USD). A strong Dollar tends to keep the price of Silver at bay, whereas a weaker Dollar is likely to propel prices up. Other factors such as investment demand, mining supply – Silver is much more abundant than Gold – and recycling rates can also affect prices.
Silver is widely used in industry, particularly in sectors such as electronics or solar energy, as it has one of the highest electric conductivity of all metals – more than Copper and Gold. A surge in demand can increase prices, while a decline tends to lower them. Dynamics in the US, Chinese and Indian economies can also contribute to price swings: for the US and particularly China, their big industrial sectors use Silver in various processes; in India, consumers’ demand for the precious metal for jewellery also plays a key role in setting prices.
Silver prices tend to follow Gold's moves. When Gold prices rise, Silver typically follows suit, as their status as safe-haven assets is similar. The Gold/Silver ratio, which shows the number of ounces of Silver needed to equal the value of one ounce of Gold, may help to determine the relative valuation between both metals. Some investors may consider a high ratio as an indicator that Silver is undervalued, or Gold is overvalued. On the contrary, a low ratio might suggest that Gold is undervalued relative to Silver.
Author

Haresh Menghani
FXStreet
Haresh Menghani is a detail-oriented professional with 10+ years of extensive experience in analysing the global financial markets.


