Silver Price Forecast: XAG/USD bulls flirt with trend-line resistance around $38.20 area
- Silver scales higher for the second straight day and tests the descending trend-line hurdle.
- The technical setup backs the case for an eventual breakout through the said barrier.
- Any corrective pullback below $38.00 is likely to be bought into and remain cushioned.

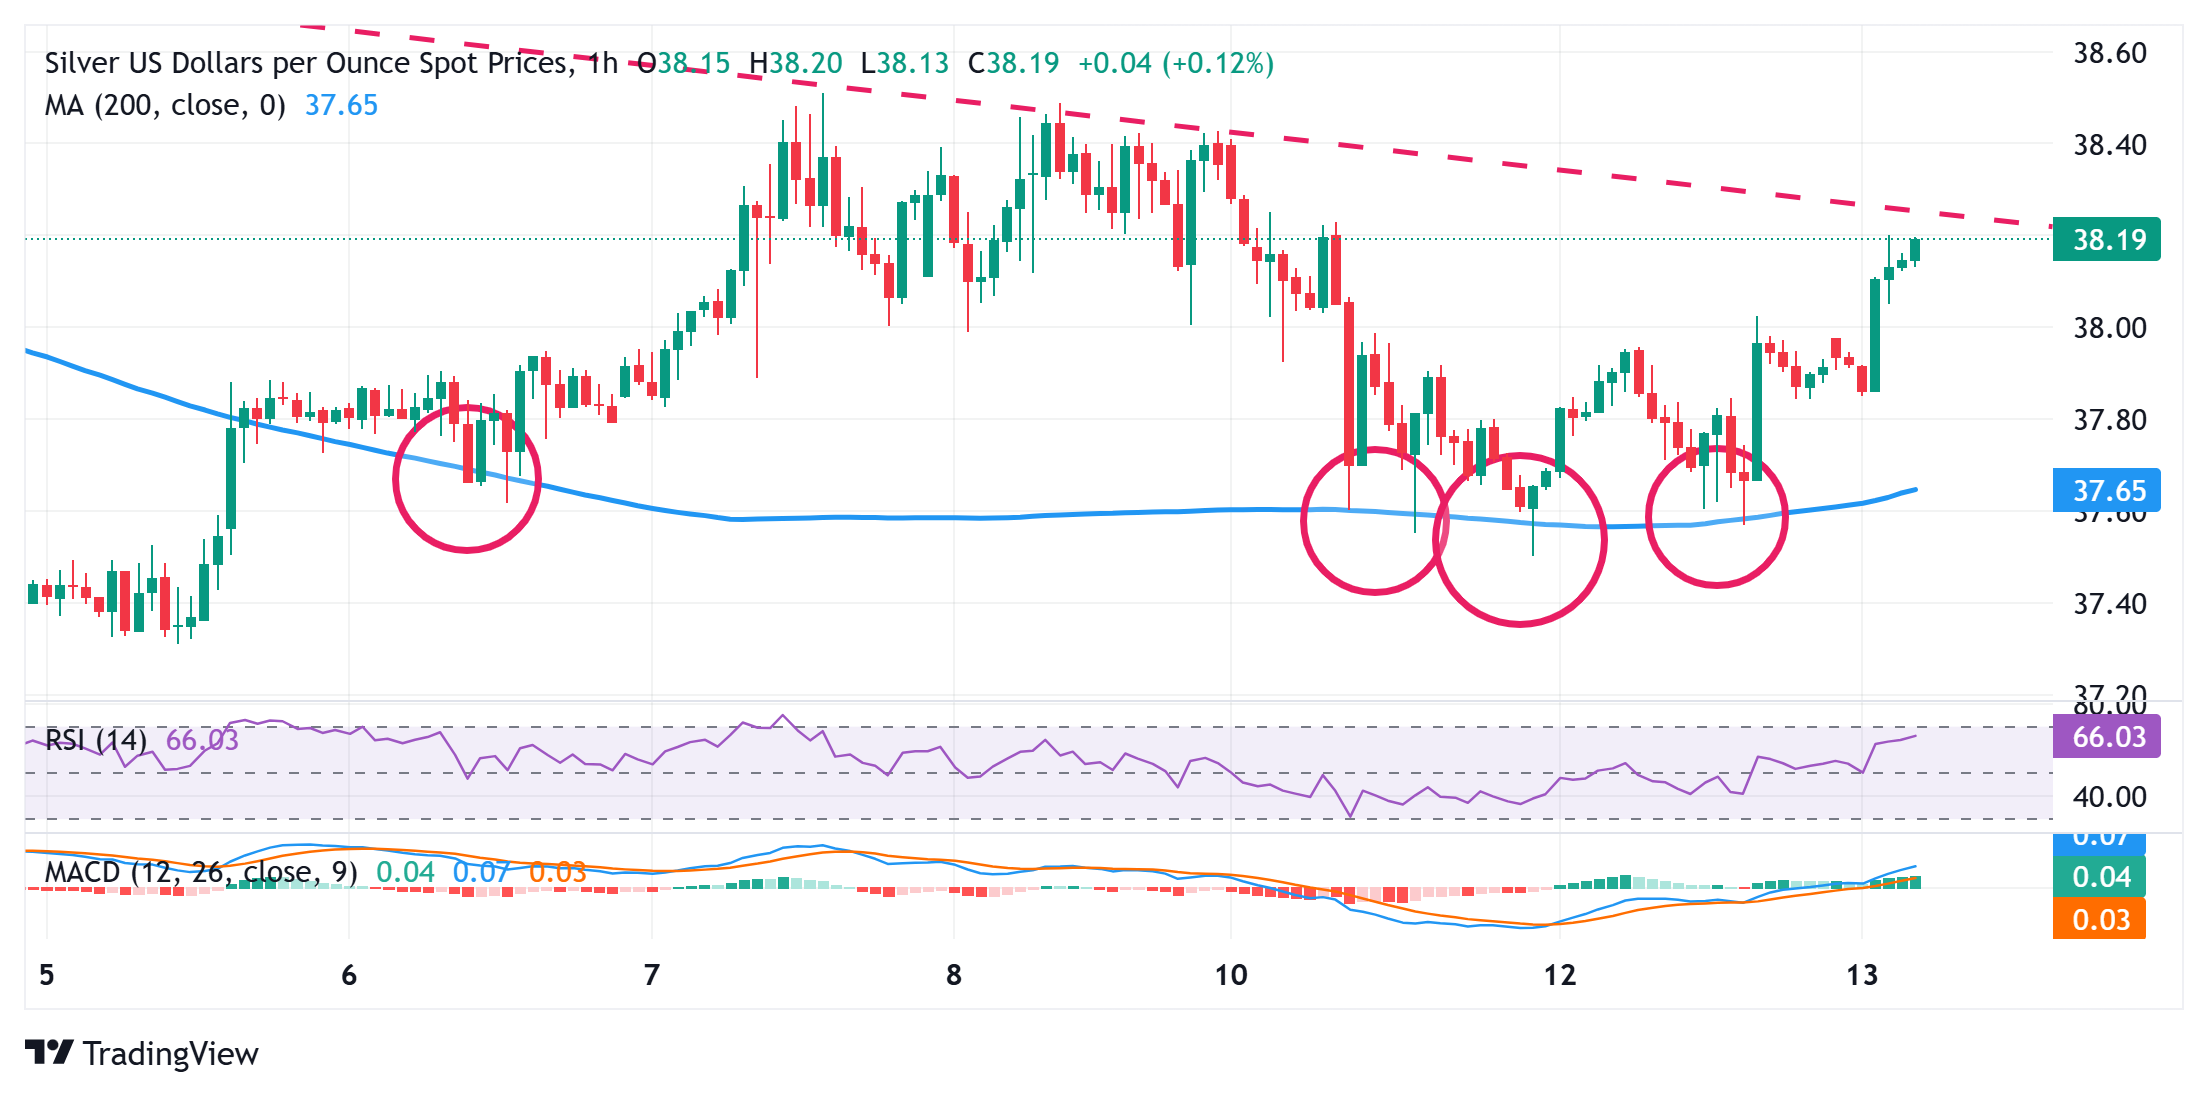
Silver (XAG/USD) gains positive traction for the second consecutive day and builds on the momentum beyond the $38.00 mark during the Asian session on Wednesday. The white metal currently trades around the $38.20 region, up over 0.70% for the day, and flirts with a descending trend-line resistance extending from a multi-year peak touched in July.
Given this week's repeated rebounds from the 200-hour Simple Moving Average (SMA) pivotal support, a sustained strength beyond the said barrier will be seen as a fresh trigger for the XAG/USD bulls. This, in turn, will set the stage for a further near-term appreciating move amid positive oscillators on daily/hourly charts. The subsequent move up could lift the white metal to the next relevant hurdle near the $38.70 area en route to the $39.00 round figure. The momentum could extend further towards the $39.50 area, or the highest since February 2012, set last month.
On the flip side, acceptance below the $38.00 mark and a further slide below the Asian session trough, around the $37.85 region, will reaffirm the trend-line resistance. The XAG/USD might then turn the overnight swing low, around mid-$37.00s, before declining further towards the $37.15-$37.10 strong horizontal resistance breakpoint. Some follow-through selling below the $37.00 round figure might shift the bias in favor of bearish traders and pave the way for a further depreciating move, towards retesting last week's swing low, around the $36.20 region.
Silver 1-hour chart
Silver FAQs
Silver is a precious metal highly traded among investors. It has been historically used as a store of value and a medium of exchange. Although less popular than Gold, traders may turn to Silver to diversify their investment portfolio, for its intrinsic value or as a potential hedge during high-inflation periods. Investors can buy physical Silver, in coins or in bars, or trade it through vehicles such as Exchange Traded Funds, which track its price on international markets.
Silver prices can move due to a wide range of factors. Geopolitical instability or fears of a deep recession can make Silver price escalate due to its safe-haven status, although to a lesser extent than Gold's. As a yieldless asset, Silver tends to rise with lower interest rates. Its moves also depend on how the US Dollar (USD) behaves as the asset is priced in dollars (XAG/USD). A strong Dollar tends to keep the price of Silver at bay, whereas a weaker Dollar is likely to propel prices up. Other factors such as investment demand, mining supply – Silver is much more abundant than Gold – and recycling rates can also affect prices.
Silver is widely used in industry, particularly in sectors such as electronics or solar energy, as it has one of the highest electric conductivity of all metals – more than Copper and Gold. A surge in demand can increase prices, while a decline tends to lower them. Dynamics in the US, Chinese and Indian economies can also contribute to price swings: for the US and particularly China, their big industrial sectors use Silver in various processes; in India, consumers’ demand for the precious metal for jewellery also plays a key role in setting prices.
Silver prices tend to follow Gold's moves. When Gold prices rise, Silver typically follows suit, as their status as safe-haven assets is similar. The Gold/Silver ratio, which shows the number of ounces of Silver needed to equal the value of one ounce of Gold, may help to determine the relative valuation between both metals. Some investors may consider a high ratio as an indicator that Silver is undervalued, or Gold is overvalued. On the contrary, a low ratio might suggest that Gold is undervalued relative to Silver.
Author

Haresh Menghani
FXStreet
Haresh Menghani is a detail-oriented professional with 10+ years of extensive experience in analysing the global financial markets.


