Silver Price Forecast: XAG/USD surges to record high above $56 amid bullish momentum
- Silver surges to a fresh all-time high above $56 as dovish Fed expectations lift metals.
- Industrial and investment demand continues to underpin the rally as Silver heads for a seventh straight monthly gain.
- A technical breakout from a falling wedge keeps bulls in firm control, with momentum indicators favouring further upside.

Silver (XAG/USD) climbs to a fresh all-time high on Friday, buoyed by dovish Federal Reserve (Fed) expectations alongside strong industrial and investment demand. At the time of writing, XAG/USD is trading around $56.40, with prices up over 12% this week and on track to log a seventh straight monthly gain.
A tightening supply backdrop is adding further support to the rally, with reports indicating that inventories at Shanghai Futures Exchange warehouses have dropped to their lowest level since 2015. Market data also show that physical Silver turnover on the Shanghai Gold Exchange has slipped to a nine-year low.
According to the Silver Institute, 2025 is on track to mark the fifth consecutive year of a structural supply deficit, with global output from mining and recycling still struggling to keep pace with rising demand from solar, electronics and investment channels.
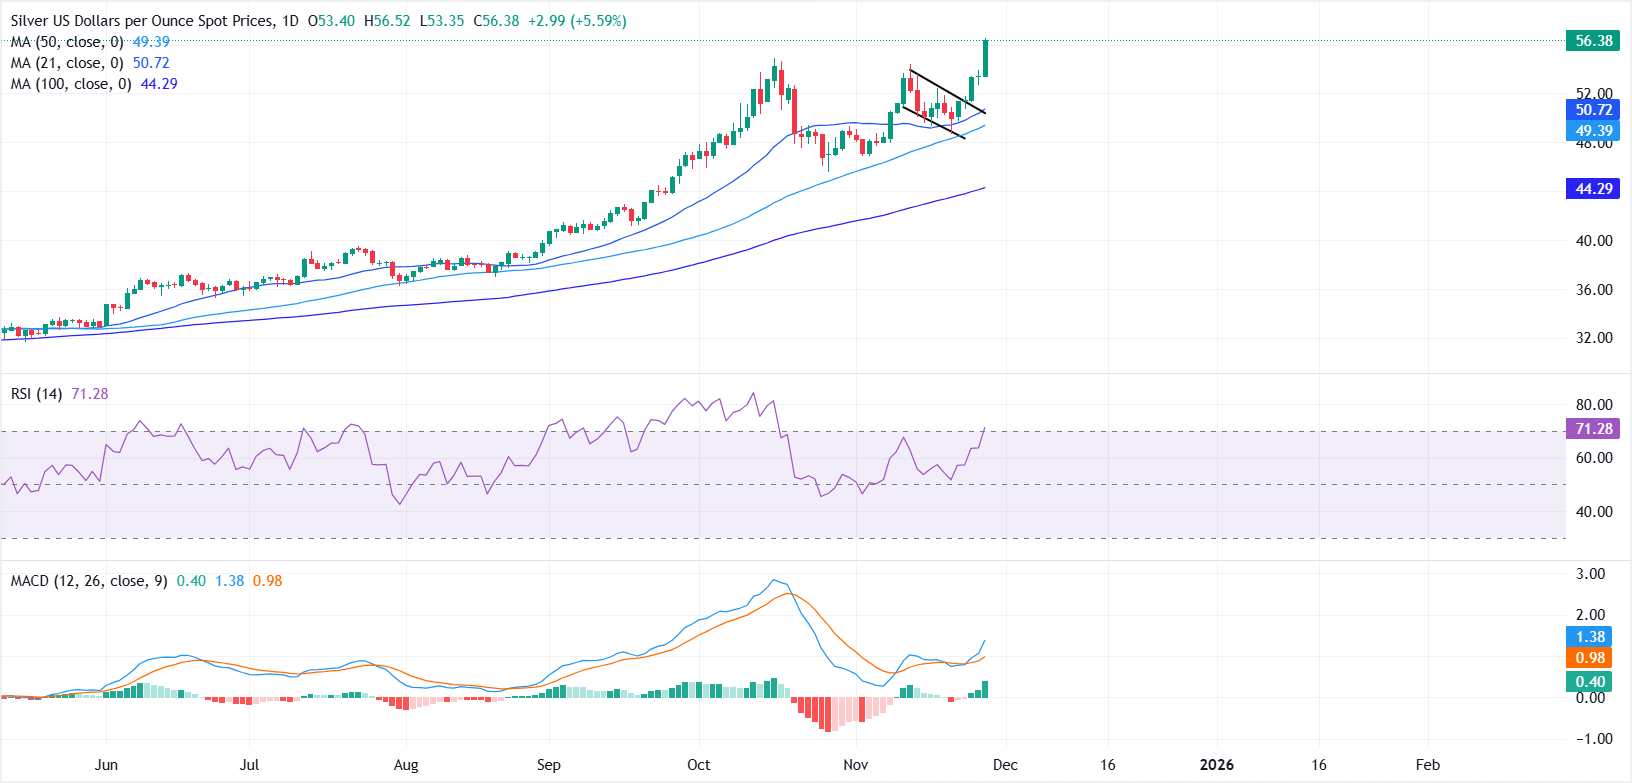
From a technical standpoint, bulls remain firmly in control, driving XAG/USD deeper into uncharted territory after a clean breakout from the falling-wedge formation. The rally comes after a period of subdued momentum, marking a clear shift back in favour of upward continuation.
XAG/USD continues to trade comfortably above all major moving averages, reinforcing the strength of the prevailing uptrend. The 21-day Simple Moving Average (SMA) near $50.72 is rising steadily and remains the first layer of dynamic support, while the 50-day and 100-day SMAs sit much lower.
On the downside, any pullback is likely to attract fresh dip-buying interest, with initial support at the $55.00-$54.00 zone. A break below this area would shift attention toward the $50.70-$50.00 region, reinforced by the rising 21-day SMA.
Momentum indicators support the bullish narrative. The Moving Average Convergence Divergence (MACD) extends above the Signal line, with both in positive territory and a widening histogram, suggesting strengthening bullish momentum. The Relative Strength Index (RSI) has climbed to 71, entering overbought territory, although there are no clear signs of exhaustion.
Silver FAQs
Silver is a precious metal highly traded among investors. It has been historically used as a store of value and a medium of exchange. Although less popular than Gold, traders may turn to Silver to diversify their investment portfolio, for its intrinsic value or as a potential hedge during high-inflation periods. Investors can buy physical Silver, in coins or in bars, or trade it through vehicles such as Exchange Traded Funds, which track its price on international markets.
Silver prices can move due to a wide range of factors. Geopolitical instability or fears of a deep recession can make Silver price escalate due to its safe-haven status, although to a lesser extent than Gold's. As a yieldless asset, Silver tends to rise with lower interest rates. Its moves also depend on how the US Dollar (USD) behaves as the asset is priced in dollars (XAG/USD). A strong Dollar tends to keep the price of Silver at bay, whereas a weaker Dollar is likely to propel prices up. Other factors such as investment demand, mining supply – Silver is much more abundant than Gold – and recycling rates can also affect prices.
Silver is widely used in industry, particularly in sectors such as electronics or solar energy, as it has one of the highest electric conductivity of all metals – more than Copper and Gold. A surge in demand can increase prices, while a decline tends to lower them. Dynamics in the US, Chinese and Indian economies can also contribute to price swings: for the US and particularly China, their big industrial sectors use Silver in various processes; in India, consumers’ demand for the precious metal for jewellery also plays a key role in setting prices.
Silver prices tend to follow Gold's moves. When Gold prices rise, Silver typically follows suit, as their status as safe-haven assets is similar. The Gold/Silver ratio, which shows the number of ounces of Silver needed to equal the value of one ounce of Gold, may help to determine the relative valuation between both metals. Some investors may consider a high ratio as an indicator that Silver is undervalued, or Gold is overvalued. On the contrary, a low ratio might suggest that Gold is undervalued relative to Silver.
Author

Vishal Chaturvedi
FXStreet
I am a macro-focused research analyst with over four years of experience covering forex and commodities market. I enjoy breaking down complex economic trends and turning them into clear, actionable insights that help traders stay ahead of the curve.


