|

Silver Price Analysis: XAG/USD turns vulnerable below 50% Fibo./100-period SMA confluence

  • Silver continues losing ground for the third straight day and drops to over a one-week low.
  • Acceptance below the $19.60-$19.55 confluence supports prospects for additional losses.
  • Weakness below the 61.8% Fibo., around the $19.30 region will reaffirm the negative bias.

Silver extends its recent pullback from the highest level since late June touched last week and remains under some selling pressure for the third straight day on Tuesday. This also marks the fourth day of a negative move in the previous five and drags the white metal to over a one-week low, around the $19.35 region during the early European session.

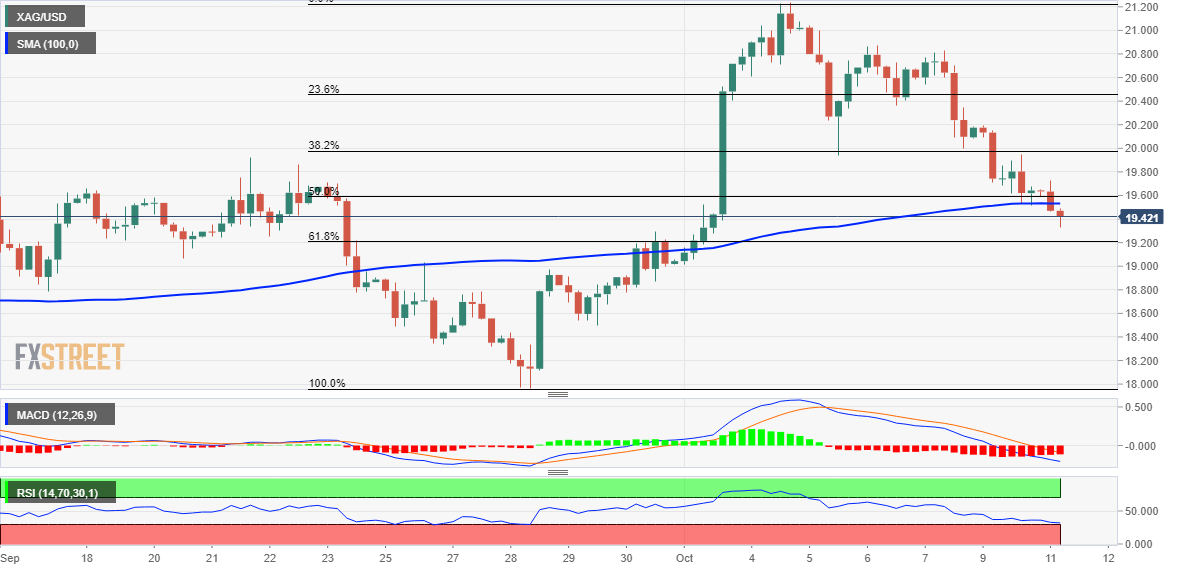
From a technical perspective, weakness below the $19.60-$19.55 confluence could be seen as a trigger for bearish traders. The said support breakpoint comprises the 50% Fibonacci retracement level of the recent recovery from the YTD low and the 100-period SMA on the 4-hour chart. The breakdown, in turn, supports prospects for further losses.

Hence, a subsequent fall towards 61.8% Fibo. level, around the $19.30 region, en route to the next relevant support near the $19.00 mark, remains a distinct possibility. Some follow-through selling will pave the way for a slide towards the $18.60 area before the XAG/USD eventually drops to the $18.35 area and then to the $18.00 round figure.

On the flip side, recovery back above the $19.60-$19.55 confluence has the potential to lift spot prices back towards the $20.00 psychological mark, which coincides with the 38.2% Fibo. level. Any further move up could attract some sellers near the 23.6% Fibo. level, around the $20.40 region, which should cap the upside for the XAG/USD, at least for now.

Sustained strength beyond will negate any near-term negative bias and allow the XAG/USD to climb to the $20.80-$20.85 area en route to the $21.00 mark and the monthly high, around the $21.25 region.

Silver 4-hour chart

fxsoriginal

Key levels to watch

XAG/USD

Overview
Today last price19.42
Today Daily Change-0.19
Today Daily Change %-0.97
Today daily open19.61
 
Trends
Daily SMA2019.55
Daily SMA5019.42
Daily SMA10019.98
Daily SMA20021.88
 
Levels
Previous Daily High20.19
Previous Daily Low19.52
Previous Weekly High21.24
Previous Weekly Low19.01
Previous Monthly High20.02
Previous Monthly Low17.56
Daily Fibonacci 38.2%19.78
Daily Fibonacci 61.8%19.93
Daily Pivot Point S119.36
Daily Pivot Point S219.1
Daily Pivot Point S318.68
Daily Pivot Point R120.03
Daily Pivot Point R220.45
Daily Pivot Point R320.7

Author

Haresh Menghani

Haresh Menghani is a detail-oriented professional with 10+ years of extensive experience in analysing the global financial markets.

More from Haresh Menghani
Share:

Markets move fast. We move first.

Orange Juice Newsletter brings you expert driven insights - not headlines. Every day on your inbox.

By subscribing you agree to our Terms and conditions.

Editor's Picks

EUR/USD recovers to 1.1750 region as 2025 draws to a close

Following the bearish action seen in the European session on Wednesday, EUR/USD regains its traction and recovery to the 1.1750 region. Nevertheless, the pair's volatility remains low as trading conditions thin out on the last day of the year.

GBP/USD stays weak near 1.3450 on modest USD recovery

GBP/USD remains under modest beairsh pressure and fluctuates at around 1.3450 on Wednesday. The US Dollar finds fresh demand due to the end-of-the-year position adjustments, weighing on the pair amid the pre-New Year trading lull. 

Gold retreats to $4,300 area, looks to post monthly gains

Gold stays on the back foot on the last day of 2025 and trades near $4,300, possibly pressured by profit-taking and position adjustments. Nevertheless, XAU/USD remains on track to post gains for December and extend its winning streak into a fifth consecutive month.

Bitcoin, Ethereum and XRP prepare for a potential New Year rebound

Bitcoin, Ethereum, and Ripple are holding steady on Wednesday after recording minor gains on the previous day. Technically, Bitcoin could extend gains within a triangle pattern while Ethereum and Ripple face critical overhead resistance. 

Economic outlook 2026-2027 in advanced countries: Solidity test

After a year marked by global economic resilience and ending on a note of optimism, 2026 looks promising and could be a year of solid economic performance. In our baseline scenario, we expect most of the supportive factors at work in 2025 to continue to play a role in 2026.

Crypto market outlook for 2026

Year 2025 was volatile, as crypto often is.  Among positive catalysts were favourable regulatory changes in the U.S., rise of Digital Asset Treasuries (DAT), adoption of AI and tokenization of Real-World-Assets (RWA).