|

Silver Price Analysis: XAG/USD turns vulnerable below $23.55 confluence support

  • Silver remains under some selling pressure for the second successive day on Monday.
  • The intraday break below the $23.55 confluence supports prospects for further losses.
  • A sustained strength beyond the $24.00 mark is needed to offset the negative outlook.

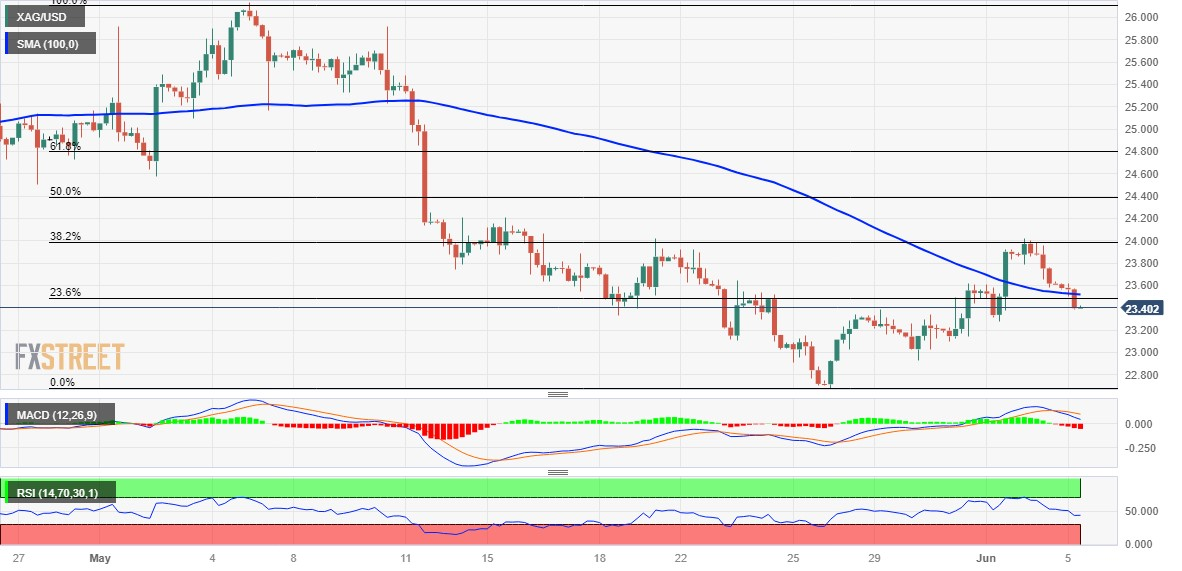
Silver extends Friday's rejection slide from the $24.00 mark, or the 38.2% Fibonacci retracement level of the downfall witnessed in May and drifts lower for the second successive day. The white metal maintains its offered tone, just below the $23.50 level through the early European session on Monday and seems vulnerable to weaken further.

From a technical perspective, the intraday slide drags the XAG/USD below the $23.55 confluence support, comprising the 23.6% Fibo. level and the 100-period Simple Moving Average (SMA) on the 4-hour chart. Moreover, bearish oscillators on daily/4-hour charts add credence to the negative outlook and support prospects for a further intraday depreciating move.

Hence, a subsequent slide, towards testing the $23.00 round figure, looks like a distinct possibility. Some follow-through selling will expose the $22.70-$22.65 region, or over a two-month low touched in May, below which the XAG/USD could eventually drop to the $22.00 mark. The latter represents the very important 200-day SMA and should act as a pivotal point.

On the flip side, sustained strength beyond the $23.55 confluence support breakpoint could allow the XAG/USD to make a fresh attempt towards conquering the $24.00 mark. This is closely followed by the $24.15-$24.20 horizontal resistance, above which the momentum could push the commodity further towards the 50% Fibo. level, around the $24.45-$24.50 region.

The XAG/USD might eventually climb to the $24.80 zone, or the 61.8% Fibo. level, and aim to reclaim the $25.00 psychological mark for the first time since May 11. The upward trajectory could get extended further towards the $25.30-$25.35 supply zone en route to the $26.00 round figure and over a one-year high, around the $26.10-$26.15 area touched in May.

Silver 4-hour chart
fxsoriginal

Key levels to watch

XAG/USD

Overview
Today last price23.4
Today Daily Change-0.21
Today Daily Change %-0.89
Today daily open23.61
 
Trends
Daily SMA2023.86
Daily SMA5024.45
Daily SMA10023.36
Daily SMA20022.12
 
Levels
Previous Daily High24.02
Previous Daily Low23.58
Previous Weekly High24.02
Previous Weekly Low22.93
Previous Monthly High26.14
Previous Monthly Low22.68
Daily Fibonacci 38.2%23.75
Daily Fibonacci 61.8%23.85
Daily Pivot Point S123.45
Daily Pivot Point S223.3
Daily Pivot Point S323.01
Daily Pivot Point R123.9
Daily Pivot Point R224.18
Daily Pivot Point R324.34

Author

Haresh Menghani

Haresh Menghani is a detail-oriented professional with 10+ years of extensive experience in analysing the global financial markets.


More from Haresh Menghani
Share:

Editor's Picks

AUD/USD bulls regain control above 0.6950 amid USD retreat

AUD/USD regains traction and extends the previous day's bounce from the weekly low, aiming for 0.7000 in Asia on Friday. The overnight pullback in US bond yields keeps the US Dollar below an 18-month high, which in turn offers some support to the pair. Meanwhile, hawkish RBA expectations also keep the major underpinned.

USD/JPY holds gains near 158.00 after Japan's weak Household Spending data

USD/JPY clings to gains around 158.00 after data showed on Friday that Japan's Household Spending fell for the ninth straight month, undermining the Japanese Yen. Meanwhile, the US Dollar remains depressed as the overnight fall in US bond yields counters a hawkish Fed and geopolitical uncertainties, could cap any downside in the pair.

Gold remains range-bound below $4,200

Gold has given up some ground after an initial bullish attempt to reach weekly highs, returning to below the $4,200 mark per troy ounce on Friday. The US Dollar’s strong upside momentum, combined with rising US Treasury yields across the curve, seems to keep further gains in the yellow metal under scrutiny.

Has Bitcoin really escaped the macro forces it was built to fight?
Over 17 years ago, Satoshi Nakamoto designed Bitcoin (BTC) on the back of a global financial crisis as an alternative to the global monetary system outside the control of central banks, governments and traditional intermediaries. This raises a key question: has Bitcoin really become independent of the macroeconomic forces it was built to challenge?
The Euro is not the sick man of Europe. France's bond market is
EUR/USD remains under pressure, near the 17-month low of 1.1161 reached on Monday. The pair has lost more than 7% since its yearly peak, as concerns over France's public finances increasingly weigh on the single currency. But behind the weakness of the Euro (EUR), the problem does not necessarily lie with the European economy as a whole.
Has Bitcoin really escaped the macro forces it was built to fight?
Over 17 years ago, Satoshi Nakamoto designed Bitcoin (BTC) on the back of a global financial crisis as an alternative to the global monetary system outside the control of central banks, governments and traditional intermediaries. This raises a key question: has Bitcoin really become independent of the macroeconomic forces it was built to challenge?














