|

Silver Price Analysis: XAG/USD struggles to reclaim ground, and turns bearish below the 200-DMA

  • Silver price sees a minor gain of 0.50% but fails to reclaim the May 26 daily low, resulting in a bearish outlook.
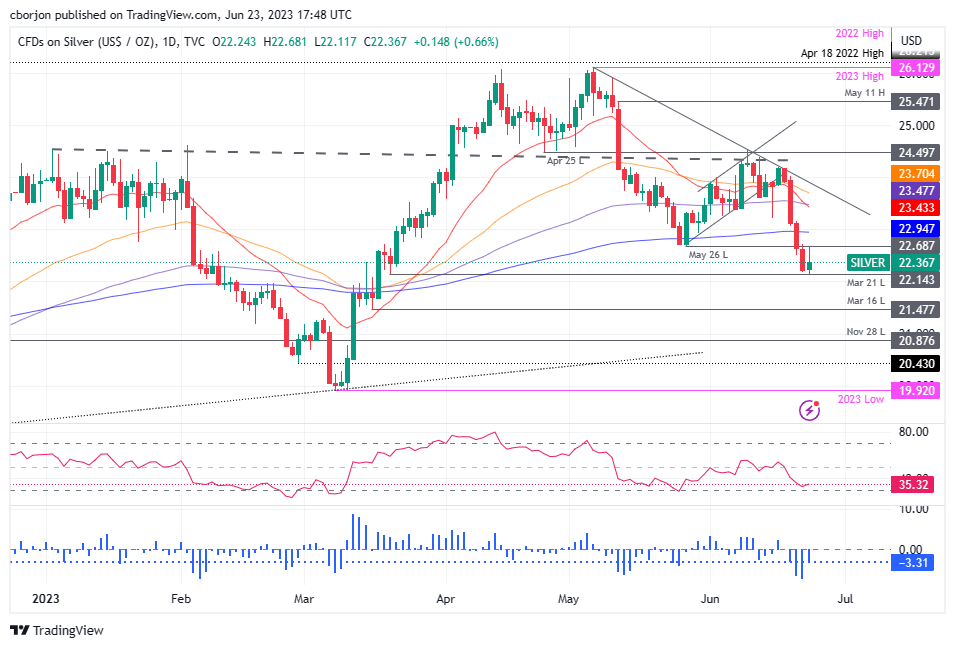
  • The technical analysis shows support at the March 21 daily low of $22.14; breaking this could see a drop below the $22.00 figure.
  • Potential resistance lies at the May 26 low-turned resistance at $22.68, with the 200-day EMA at $22.94 and $23.00 as the next challenges.

Silver price remains firm in the session but could not reclaim the May 26 daily low; previous support turned resistance and also below the 200-day Exponential Moving Average (EMA). Therefore, the XAG/USD turned bearish from a technical perspective. The XAG/USD is trading at $22.32, a gain of 0.50%.

Must read: Gold Price Forecast: XAU/USD rebounds amid recession fears, slowing global economic growth

XAG/USD Price Analysis: Technical outlook

Silver is downward biased but must break support at the March 21 daily low of $22.14 on its way toward dropping below the $22.00 figure. Even though the XAG/USD fell to a new three-month high, cheered by sellers, the XAG/USD could remain trading sideways, within the $22.10/$22.69 area without a catalyst.

If XAG/USD slumps below $22.00, the next support will lie at the March 16 low of $21.46 before exposing the $21.00 figure and the November 28 daily low at $20.87. On the flip side, the XAG/USD stays above $22.00. The next resistance would be the May 26 low-turned resistance at $22.68, followed by the 200-day EMA at $22.94 ahead of challenging $23.00.

From an oscillator point of view, the Relative Strength Index (RSI) shows signs of bearishness, while the three-day Rate of Change (RoC) portrays sellers losing some momentum but remaining in charge.

XAG/USD Price Action – Daily chart

XAG/USD Daily chart

XAG/USD

Overview
Today last price22.39
Today Daily Change0.14
Today Daily Change %0.63
Today daily open22.25
 
Trends
Daily SMA2023.58
Daily SMA5024.25
Daily SMA10023.33
Daily SMA20022.47
 
Levels
Previous Daily High22.74
Previous Daily Low22.18
Previous Weekly High24.4
Previous Weekly Low23.22
Previous Monthly High26.14
Previous Monthly Low22.68
Daily Fibonacci 38.2%22.39
Daily Fibonacci 61.8%22.52
Daily Pivot Point S122.04
Daily Pivot Point S221.83
Daily Pivot Point S321.49
Daily Pivot Point R122.6
Daily Pivot Point R222.94
Daily Pivot Point R323.15

Author

Christian Borjon Valencia

Christian Borjon began his career as a retail trader in 2010, mainly focused on technical analysis and strategies around it. He started as a swing trader, as he used to work in another industry unrelated to the financial markets.

More from Christian Borjon Valencia
Share:

Markets move fast. We move first.

Orange Juice Newsletter brings you expert driven insights - not headlines. Every day on your inbox.

By subscribing you agree to our Terms and conditions.

Editor's Picks

EUR/USD moves sideways below 1.1800 on Christmas Eve

EUR/USD struggles to find direction and trades in a narrow channel below 1.1800 after posting gains for two consecutive days. Bond and stock markets in the US will open at the usual time and close early on Christmas Eve, allowing the trading action to remain subdued. 

GBP/USD keeps range around 1.3500 amid quiet markets

GBP/USD keeps its range trade intact at around 1.3500 on Wednesday. The Pound Sterling holds the upper hand over the US Dollar amid pre-Christmas light trading as traders move to the sidelines heading into the holiday season. 

Gold retreats from record highs, trades below $4,500

Gold retreats after setting a new record-high above $4,520 earlier in the day and trades in a tight range below $4,500 as trading volumes thin out ahead of the Christmas break. The US Dollar selling bias remains unabated on the back of dovish Fed expectations, which continues to act as a tailwind for the bullion amid persistent geopolitical risks.

Bitcoin slips below $87,000 as ETF outflows intensify, whale participation declines

Bitcoin price continues to trade around $86,770 on Wednesday, after failing to break above the $90,000 resistance. US-listed spot ETFs record an outflow of $188.64 million on Tuesday, marking the fourth consecutive day of withdrawals.

Economic outlook 2026-2027 in advanced countries: Solidity test

After a year marked by global economic resilience and ending on a note of optimism, 2026 looks promising and could be a year of solid economic performance. In our baseline scenario, we expect most of the supportive factors at work in 2025 to continue to play a role in 2026.

Avalanche struggles near $12 as Grayscale files updated form for ETF

Avalanche trades close to $12 by press time on Wednesday, extending the nearly 2% drop from the previous day. Grayscale filed an updated form to convert its Avalanche-focused Trust into an ETF with the US Securities and Exchange Commission.