• Silver price falls below the psychological $21.00 after failing to hurdle the 200-day EMA.
  • The break of an upslope trendline exacerbated a fall from daily highs around $21.60s.
  • XAG/USD Price Analysis: Break below $20.89 to pave the way to $20.00.

Silver price tumbles below $21.00 late in the North American session amidst risk aversion and the recovery of the US Dollar (USD), as shown by the US Dollar Index (DXY) gaining 0.40% in the day. At the time of writing, the XAG/USD is trading at $20.95, below its opening price by almost 2%.

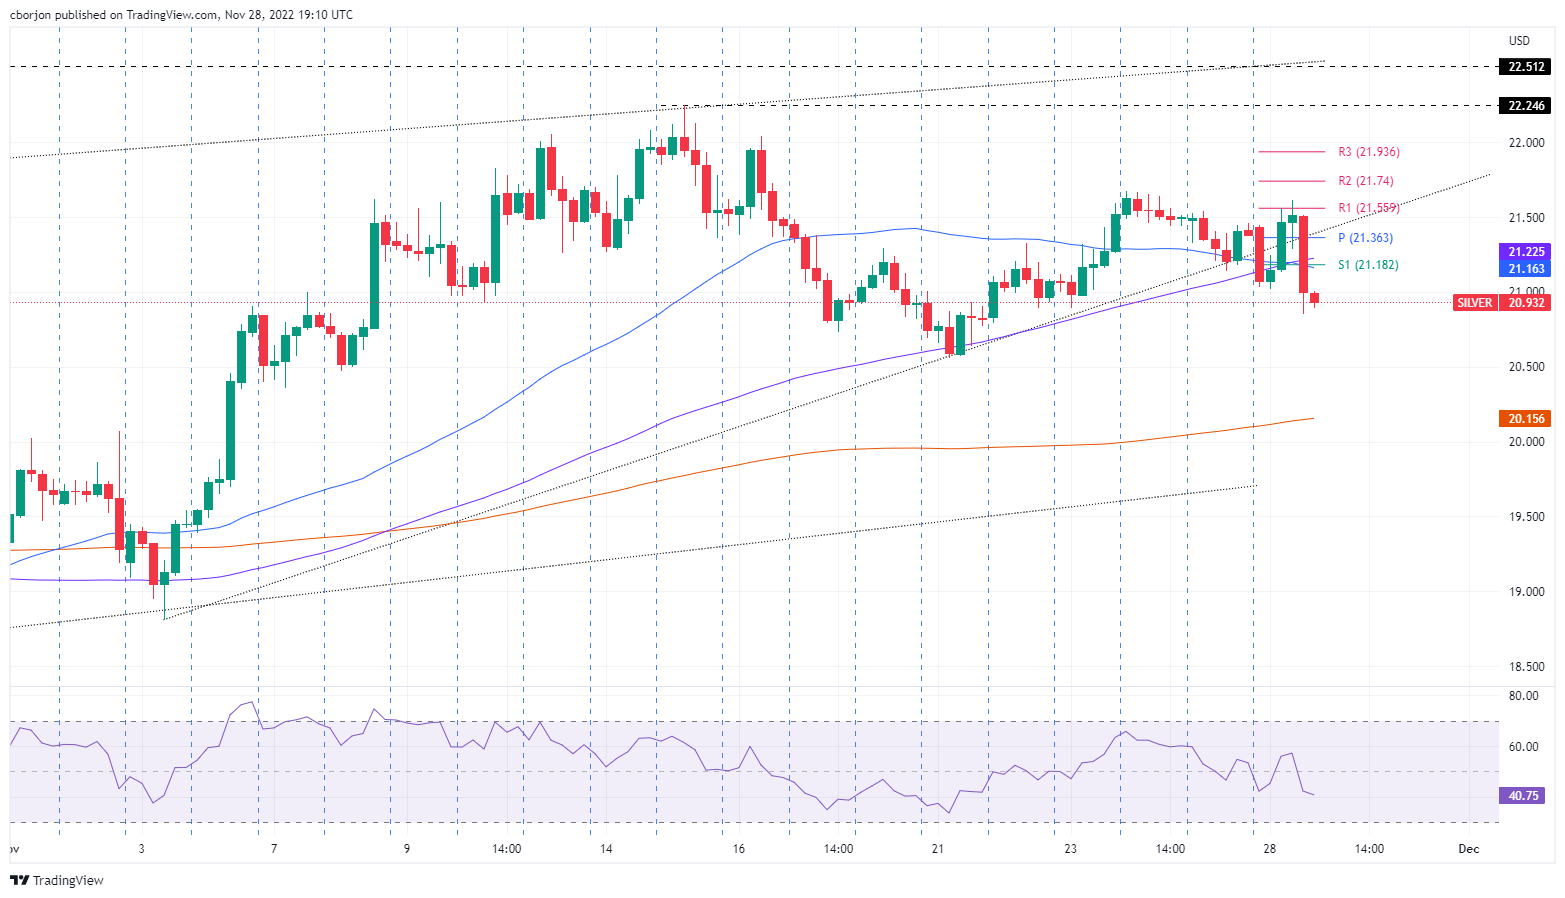
Silver Price Analysis (XAG/USD): Technical outlook

After XAG/USD failed to crack the 200-day Exponential Moving Average (EMA) at $21.34, the white metal is extending its losses below the $21.00 figure. It should be noted that Silver broke below a 20-day-old upslope trendline, exacerbating Silver’s drop. The Relative Strength Index (RSI), aiming towards the 50-midline, is accelerating, suggesting that sellers are gathering momentum.

Short term, the XAG/USD 4-hour chart portrays sellers’ strength. Notably, XAG/USD hit a daily high of around $21.61 before tumbling and reclaiming the 50 and 100-EMAs. Therefore, the XAG/USD path of least resistance is tilted to the downside. That said, the XAG/USD first support would be November 23, swing low at $20.89. Once cleared, the next support would be the November 21 pivot low at $20.56, followed by the 200-Exponential Moving Average (EMA) at $20.15.

As an alternate scenario, XAG/USD first resistance would be the confluence of the S1 pivot and the 40-EMA at $21.16, followed by the daily pivot point at $21.36, ahead of the R1 pivot at $21.55.

Silver Key Technical Levels

XAG/USD

Overview
Today last price 20.94
Today Daily Change -0.52
Today Daily Change % -2.42
Today daily open 21.46
 
Trends
Daily SMA20 20.91
Daily SMA50 19.96
Daily SMA100 19.6
Daily SMA200 21.37
 
Levels
Previous Daily High 21.56
Previous Daily Low 21.16
Previous Weekly High 21.68
Previous Weekly Low 20.58
Previous Monthly High 21.24
Previous Monthly Low 18.09
Daily Fibonacci 38.2% 21.31
Daily Fibonacci 61.8% 21.4
Daily Pivot Point S1 21.23
Daily Pivot Point S2 21
Daily Pivot Point S3 20.83
Daily Pivot Point R1 21.62
Daily Pivot Point R2 21.79
Daily Pivot Point R3 22.02


Share: Feed news

Information on these pages contains forward-looking statements that involve risks and uncertainties. Markets and instruments profiled on this page are for informational purposes only and should not in any way come across as a recommendation to buy or sell in these assets. You should do your own thorough research before making any investment decisions. FXStreet does not in any way guarantee that this information is free from mistakes, errors, or material misstatements. It also does not guarantee that this information is of a timely nature. Investing in Open Markets involves a great deal of risk, including the loss of all or a portion of your investment, as well as emotional distress. All risks, losses and costs associated with investing, including total loss of principal, are your responsibility. The views and opinions expressed in this article are those of the authors and do not necessarily reflect the official policy or position of FXStreet nor its advertisers. The author will not be held responsible for information that is found at the end of links posted on this page.

If not otherwise explicitly mentioned in the body of the article, at the time of writing, the author has no position in any stock mentioned in this article and no business relationship with any company mentioned. The author has not received compensation for writing this article, other than from FXStreet.

FXStreet and the author do not provide personalized recommendations. The author makes no representations as to the accuracy, completeness, or suitability of this information. FXStreet and the author will not be liable for any errors, omissions or any losses, injuries or damages arising from this information and its display or use. Errors and omissions excepted.

The author and FXStreet are not registered investment advisors and nothing in this article is intended to be investment advice.

Recommended content


Recommended content

Editors’ Picks

AUD/USD: Further losses retarget the 200-day SMA

AUD/USD: Further losses retarget the 200-day SMA

Further gains in the greenback and a bearish performance of the commodity complex bolstered the continuation of the selling pressure in AUD/USD, which this time revisited three-day lows near 0.6560.

AUD/USD News

EUR/USD: Further weakness remains on the cards

EUR/USD: Further weakness remains on the cards

EUR/USD added to Tuesday’s pullback and retested the 1.0730 region on the back of the persistent recovery in the Greenback, always against the backdrop of the resurgence of the Fed-ECB monetary policy divergence.

EUR/USD News

Gold flirts with $2,320 as USD demand losses steam

Gold flirts with $2,320 as USD demand losses steam

Gold struggles to make a decisive move in either direction and moves sideways in a narrow channel above $2,300. The benchmark 10-year US Treasury bond yield clings to modest gains near 4.5% and limits XAU/USD's upside.

Gold News

Bitcoin price dips to $61K range, encourages buying spree among BTC fish, dolphins and sharks

Bitcoin price dips to $61K range, encourages buying spree among BTC fish, dolphins and sharks

Bitcoin (BTC) price is chopping downwards on the one-day time frame, while the outlook seen in the one-week period is a horizontal trade. In this shakeout moment, data shows that large holders are using the correction to buy up BTC.

Read more

Navigating the future of precious metals

Navigating the future of precious metals

In a recent episode of the Vancouver Resource Investment Conference podcast, hosted by Jesse Day, guests Stefan Gleason and JP Cortez shared their expert analysis on the dynamics of the gold and silver markets and discussed legislative efforts to promote these metals as sound money in the United States.

Read more

Forex MAJORS

Cryptocurrencies

Signatures