- Silver prints mild losses while staying below short-term resistance line, 200-bar SMA.
- Easing RSI from the overbought conditions, weak MACD favor sellers.
- Last Monday’s top can lure short-term bears, bulls need an upside break of early-September low for fresh entry.
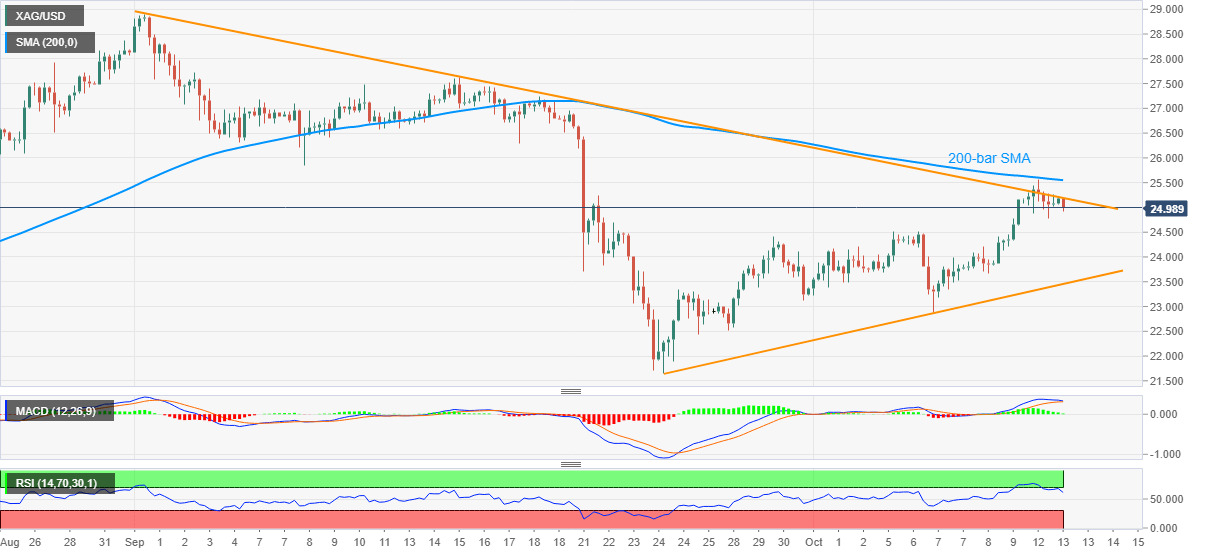
Silver prices remain on the back foot, currently down 0.30% at $24.95, during Tuesday’s Asian session. The white metal recently took a U-turn from 200-bar SMA while slipping back below a descending trend line from September 01. The recent weakness in the commodity also follows the RSI’s pullback moves from the overbought region, as well as MACD histogram’s abating upside signals.
As a result, sellers are looking towards October 01 high near $24.50 as immediate support, a break of which will challenge an ascending trend line from September 24, at 23.45 now.
In a case where the bears keep the reins past-$23.45, the monthly bottom near $22.85 and the previous month’s low surrounding $21.65 will gain the market’s attention.
On the flip side, the immediate resistance line and 200-bar SMA, respectively around $25.20 and $25.55, can challenge short-term buyers.
Also likely to probe silver’s immediate upside attempts will be the September 08 low near $25.85.
Silver four-hour chart
Trend: Further weakness expected
Information on these pages contains forward-looking statements that involve risks and uncertainties. Markets and instruments profiled on this page are for informational purposes only and should not in any way come across as a recommendation to buy or sell in these assets. You should do your own thorough research before making any investment decisions. FXStreet does not in any way guarantee that this information is free from mistakes, errors, or material misstatements. It also does not guarantee that this information is of a timely nature. Investing in Open Markets involves a great deal of risk, including the loss of all or a portion of your investment, as well as emotional distress. All risks, losses and costs associated with investing, including total loss of principal, are your responsibility. The views and opinions expressed in this article are those of the authors and do not necessarily reflect the official policy or position of FXStreet nor its advertisers. The author will not be held responsible for information that is found at the end of links posted on this page.
If not otherwise explicitly mentioned in the body of the article, at the time of writing, the author has no position in any stock mentioned in this article and no business relationship with any company mentioned. The author has not received compensation for writing this article, other than from FXStreet.
FXStreet and the author do not provide personalized recommendations. The author makes no representations as to the accuracy, completeness, or suitability of this information. FXStreet and the author will not be liable for any errors, omissions or any losses, injuries or damages arising from this information and its display or use. Errors and omissions excepted.
The author and FXStreet are not registered investment advisors and nothing in this article is intended to be investment advice.
Recommended content
Editors’ Picks
EUR/USD consolidates recovery below 1.0700 amid upbeat mood
EUR/USD is consolidating its recovery but remains below 1.0700 in early Europe on Thursday. The US Dollar holds its corrective decline amid a stabilizing market mood, despite looming Middle East geopolitical risks. Speeches from ECB and Fed officials remain on tap.
GBP/USD advances toward 1.2500 on weaker US Dollar
GBP/USD is extending recovery gains toward 1.2500 in the European morning on Thursday. The pair stays supported by a sustained US Dollar weakness alongside the US Treasury bond yields. Risk appetite also underpins the higher-yielding currency pair. ahead of mid-tier US data and Fedspeak.
Gold appears a ‘buy-the-dips’ trade on simmering Israel-Iran tensions
Gold price attempts another run to reclaim $2,400 amid looming geopolitical risks. US Dollar pulls back with Treasury yields despite hawkish Fedspeak, as risk appetite returns.
Manta Network price braces for volatility as $44 million worth of MANTA is due to flood markets
Manta Network price is defending support at $1.80 as multiple technical indicators flash bearish. 21.67 million MANTA tokens worth $44 million are due to flood markets in a cliff unlock on Thursday.
Have we seen the extent of the Fed rate repricing?
Markets have been mostly consolidating recent moves into Thursday. We’ve seen some profit taking on Dollar longs and renewed demand for US equities into the dip. Whether or not this holds up is a completely different story.