|

Silver Price Analysis: XAG/USD slumps below $29.00 as bears eye 50-DMA

  • Silver prices have fallen aggressively during the last six days, with losses of more than 7%.
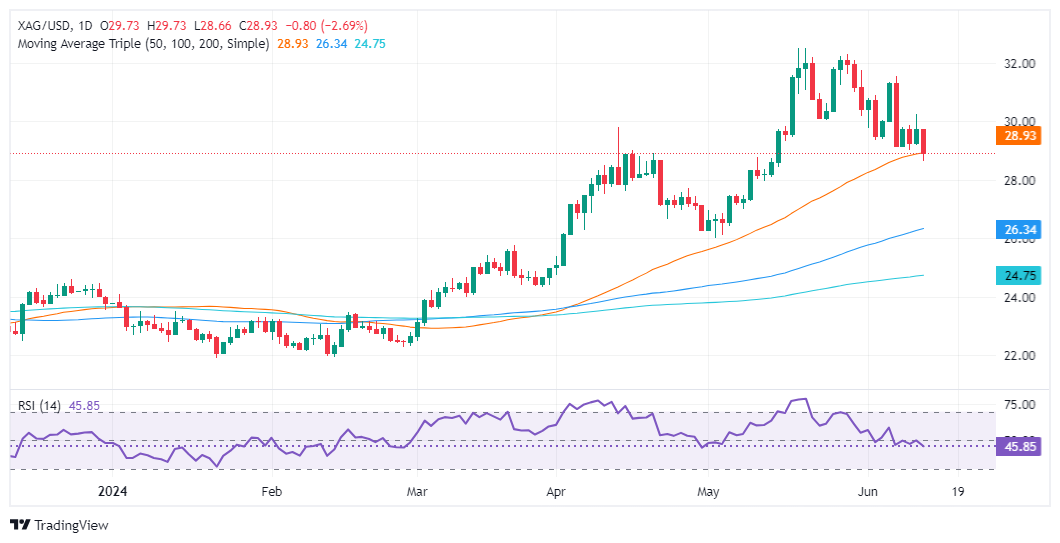
  • Momentum supports further downside as RSI turned bearish.
  • Key support levels are seen at $28.74, followed by $26.40 and $26.02.

Silver prices registered losses of more than 2.40% on Thursday after the Federal Reserve held rates unchanged and hinted that they would likely cut once instead of the three foreseen in the March Summary of Economic Projections (SEP). At the time of writing, the XAG/USD trades at $28.95.

XAG/USD Price Analysis: Technical outlook

From a price action standpoint, the XAG/USD is neutral to upward biased. The downtrend is capped by the presence of the 50-day moving average (DMA) at around $28.74, which is seen as the first support level. The grey metal bounced from around three-week lows of $28.66 to current spot prices.

Momentum remains bearish, as the Relative Strength Index (RSI) depicts. Hence, if XAG/USD achieves a daily close below the 50-DMA, the Silver price could plunge to the next support level seen at the 100-DMA at $26.40, ahead of the May 2 low of $26.02.

On the other hand, if Silver buyers conquer $29.00, they must clear the $30.00 handle, if they would like to re-test the year-to-date (YTD) high of $32.51.

XAG/USD Price Action – Daily Chart

XAG/USD

Overview
Today last price28.96
Today Daily Change-0.77
Today Daily Change %-2.59
Today daily open29.73
 
Trends
Daily SMA2030.65
Daily SMA5028.89
Daily SMA10026.28
Daily SMA20024.72
 
Levels
Previous Daily High30.26
Previous Daily Low29.18
Previous Weekly High31.55
Previous Weekly Low29.12
Previous Monthly High32.51
Previous Monthly Low26.02
Daily Fibonacci 38.2%29.85
Daily Fibonacci 61.8%29.59
Daily Pivot Point S129.19
Daily Pivot Point S228.65
Daily Pivot Point S328.12
Daily Pivot Point R130.26
Daily Pivot Point R230.8
Daily Pivot Point R331.33

Author

Christian Borjon Valencia

Markets analyst, news editor, and trading instructor with over 14 years of experience across FX, commodities, US equity indices, and global macro markets.

More from Christian Borjon Valencia
Share:

Editor's Picks

AUD/USD eyes 0.7150 barrier nine-day EMA

AUD/USD inches higher after registering modest losses in the previous day, trading around 0.7130 during the Asian hours. The technical analysis of the daily chart indicates that the pair is moving sideways within the rectangle pattern, suggesting a consolidation as neither the bulls nor the bears have enough momentum to take control of the market.

USD/JPY trades below 160.00 intervention threshold; bullish bias intact

The USD/JPY pair attracts some sellers during the Asian session amid fears that authorities will step in again to prop up the Japanese Yen. Furthermore, the Israel-Lebanon truce prompts some profit-taking around the US Dollar and exerts downward pressure on the currency pair.

Gold puts its 200-day SMA to the test near $4,420

Gold keeps the bullish stance in place in the latter part of Thursday’s session, although a convincing break above the key $4,500 mark per troy ounce still remains elusive. The precious metal’s advance comes amid the resurgence of some selling interest around the Greenback, improving risk sentiment, and declining US Treasury yields across the board.

Bitcoin’s massive storm is back: Why the sell-off is far from over

Bitcoin price action over the last few weeks has felt less like a normal, healthy correction and more like a slow grinding crash that continues to wreak havoc on holdings and trading accounts. And everything suggests that the dramatic crash isn’t over.

Nonfarm payrolls: Testing the limits of Fed policy patience

The upcoming nonfarm payrolls report for May will provide the final update on the US labor market before Kevin Warsh attends his first policy meeting as the new Fed Chair later this month.

Recession on paper: What really moves the Canadian Loonie now?

Statistics Canada handed the headline writers a gift and the analysts a headache. Real GDP shrank 0.1% on an annualized basis in the first quarter, and with the fourth quarter of 2025 revised down to a 1.0% contraction, that is two negative quarters in a row, the textbook definition of a technical recession and Canada's first since the pandemic.