|

Silver Price Analysis: XAG/USD sellers cheer 100-day SMA break near one-month low

  • Silver bears catch a breather after refreshing multi-day low.
  • Downside break of 100-day SMA directs sellers toward an ascending trend line from March 18.
  • Bulls look for entries beyond previous support line.

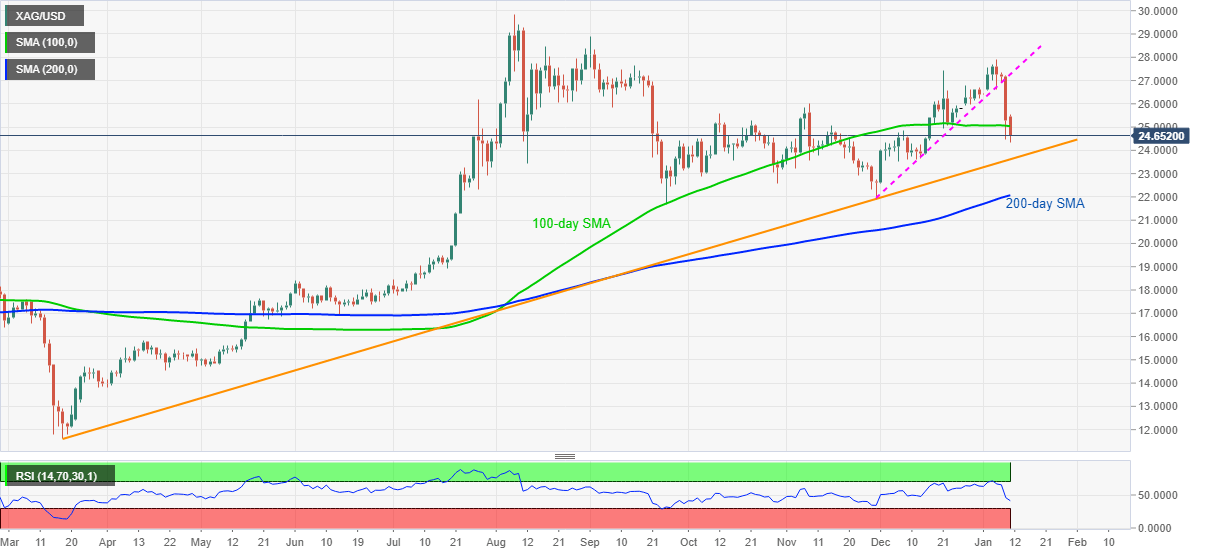
Having dropped to a fresh low since the mid-December, silver takes rounds to $24.60, down 2.70%, during early Monday. While a downside break of an ascending trend line from November 30 pleased the commodity sellers during last week, the latest south-run below 100-day SMA highlights a multi-month-old support line for sellers.

It should be noted that an absence of oversold RSI adds strength to the downside momentum.

That said, the $24.00 round-figure can offer an intermediate halt during the fall targeting an aforementioned support line, currently near $23.60.

Also acting as the key support is 200-day SMA, at $22.07 now, followed by November’s low of $21.89.

On the contrary, an upside break of 100-day SMA, currently around $25.03 can aim for November’s top near $26.00. However, any further rise needs to regain above the previous support line, at $27.25, to convince buyers. Additionally, the monthly high of $27.92 acts as an extra filter to the north.

Overall, silver prices have some more room to the downside before confronting the key technical supports.

Silver daily chart

Trend: Further weakness expected

Additional important levels

Overview
Today last price24.63
Today Daily Change-0.66
Today Daily Change %-2.61%
Today daily open25.29
 
Trends
Daily SMA2026.03
Daily SMA5024.86
Daily SMA10025.06
Daily SMA20022.02
 
Levels
Previous Daily High27.21
Previous Daily Low24.47
Previous Weekly High27.92
Previous Weekly Low24.47
Previous Monthly High27.41
Previous Monthly Low22.59
Daily Fibonacci 38.2%25.52
Daily Fibonacci 61.8%26.17
Daily Pivot Point S124.11
Daily Pivot Point S222.92
Daily Pivot Point S321.36
Daily Pivot Point R126.85
Daily Pivot Point R228.4
Daily Pivot Point R329.59

Author

Anil Panchal

Anil Panchal

FXStreet

Anil Panchal has nearly 15 years of experience in tracking financial markets. With a keen interest in macroeconomics, Anil aptly tracks global news/updates and stays well-informed about the global financial moves and their implications.

More from Anil Panchal
Share:

Markets move fast. We move first.

Orange Juice Newsletter brings you expert driven insights - not headlines. Every day on your inbox.

By subscribing you agree to our Terms and conditions.

Editor's Picks

EUR/USD falls toward 1.1700 on broad USD recovery

EUR/USD turns south and declines toward 1.1700 on Wednesday. The US Dollar gathers recovery momentum and forces the pair to stay on the back foor, as traders look to USD short-covering ahead of US inflation report on Thursday. However, the downside could be capped by hawkish ECB expectations. 

GBP/USD trades deep in red below 1.3350 after soft UK inflation data

GBP/USD stays under strong selling pressure midweek and trades below 1.3350. The UK annual headline and core CPI rose by 3.2% each, missing estimates of 3.5% and 3.4%, respectively, reaffirming dovish BoE expectations and smashing the Pound Sterling across the board ahead of Thurday's BoE policy announcements. 

Gold clings to moderate daily gains above $4,300

Following Tuesday's volatile action, Gold regains its traction on Wednesday and trades in positive territory above $4,300. While the buildup in the USD recovery momentum caps XAU/USD's upside, the cautious market stance helps the pair hold its ground.

Bitcoin risks deeper correction as ETF outflows mount, derivative traders stay on the sidelines

Bitcoin (BTC) remains under pressure, trading below $87,000 on Wednesday, nearing a key support level. A decisive daily close below this zone could open the door to a deeper correction.

Monetary policy: Three central banks, three decisions, the same caution

While the Fed eased its monetary policy on 10 December for the third consecutive FOMC meeting, without making any guarantees about future action, the BoE, the ECB and the BoJ are holding their respective meetings this week. 

AAVE slips below $186 as bearish signals outweigh the SEC investigation closure

Aave (AAVE) price continues its decline, trading below $186 at the time of writing on Wednesday after a rejection at the key resistance zone. Derivatives positioning and momentum indicators suggest that bearish forces still dominate in the near term.