|

Silver Price Analysis: XAG/USD retreats towards $25.00 on overbought RSI signals

  • Silver pares the biggest daily gains in a year, stays near six-month high flashed the last week.
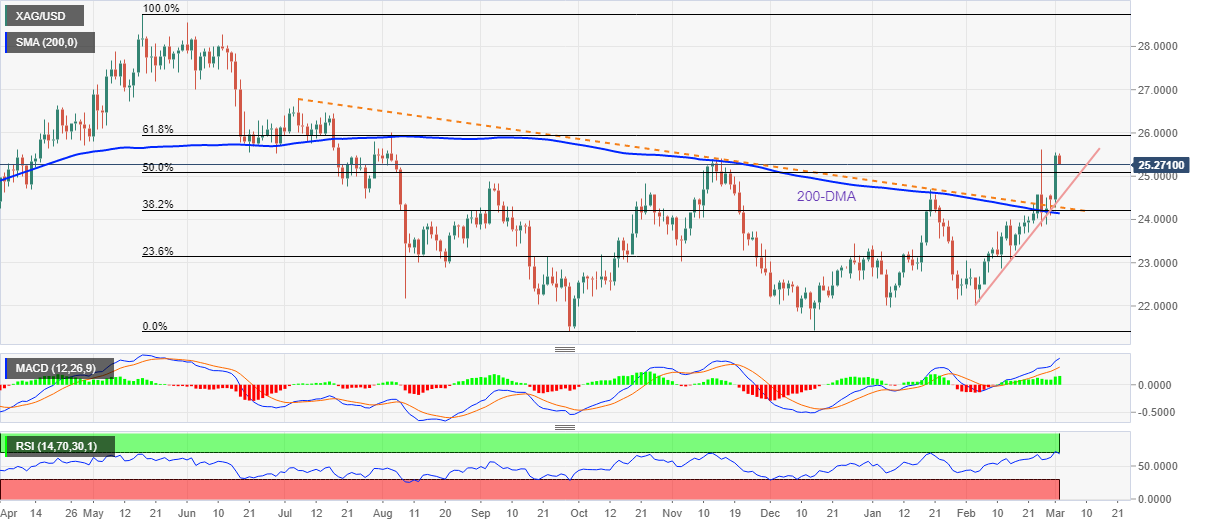
  • Overbought RSI hints at a pullback towards the previous resistance line but buyers remain hopeful beyond 200-DMA.
  • 61.8% Fibonacci retracement, July 2021 peak adds to the upside filters.

Silver (XAG/USD) buyers take a breather around $25.30, down 0.70% intraday during Wednesday’s Asian session.

In doing so, the quote takes a U-turn from a weekly high to consolidate the biggest daily jump in 12 months, marked the previous day. Overbought RSI conditions add strength to the pullback moves.

However, the resistance-turned-support line from July 2021, near $24.25, followed by the 200-DMA level near $24.10, limits the short-term downside of the silver prices.

It’s worth noting that a monthly support line near $24.50 acts as extra support to challenge XAG/USD bears.

Alternatively, the previous week’s high around $25.65, also the highest since August 2021, challenge the silver buyers during the fresh upside.

In a case where XAG/USD bulls cross $25.65, the 61.8% Fibonacci retracement of May-September 2021 downside and July 2021 high, respectively around $26.00 and $26.80, will act as strong resistances.

Silver: Daily chart

Trend: Pullback expected

Additional important levels 

Overview
Today last price25.29
Today Daily Change-0.19
Today Daily Change %-0.75%
Today daily open25.48
 
Trends
Daily SMA2023.68
Daily SMA5023.32
Daily SMA10023.42
Daily SMA20024.15
 
Levels
Previous Daily High25.54
Previous Daily Low24.28
Previous Weekly High25.62
Previous Weekly Low23.7
Previous Monthly High25.62
Previous Monthly Low22.01
Daily Fibonacci 38.2%25.06
Daily Fibonacci 61.8%24.77
Daily Pivot Point S124.66
Daily Pivot Point S223.84
Daily Pivot Point S323.4
Daily Pivot Point R125.92
Daily Pivot Point R226.36
Daily Pivot Point R327.18

Author

Anil Panchal

Anil Panchal

FXStreet

Anil Panchal has nearly 15 years of experience in tracking financial markets. With a keen interest in macroeconomics, Anil aptly tracks global news/updates and stays well-informed about the global financial moves and their implications.

More from Anil Panchal
Share:

Editor's Picks

AUD/USD eyes 0.7150 barrier nine-day EMA

AUD/USD inches higher after registering modest losses in the previous day, trading around 0.7130 during the Asian hours. The technical analysis of the daily chart indicates that the pair is moving sideways within the rectangle pattern, suggesting a consolidation as neither the bulls nor the bears have enough momentum to take control of the market.

USD/JPY trades below 160.00 intervention threshold; bullish bias intact

The USD/JPY pair attracts some sellers during the Asian session amid fears that authorities will step in again to prop up the Japanese Yen. Furthermore, the Israel-Lebanon truce prompts some profit-taking around the US Dollar and exerts downward pressure on the currency pair.

Gold puts its 200-day SMA to the test near $4,420

Gold keeps the bullish stance in place in the latter part of Thursday’s session, although a convincing break above the key $4,500 mark per troy ounce still remains elusive. The precious metal’s advance comes amid the resurgence of some selling interest around the Greenback, improving risk sentiment, and declining US Treasury yields across the board.

Bitcoin’s massive storm is back: Why the sell-off is far from over

Bitcoin price action over the last few weeks has felt less like a normal, healthy correction and more like a slow grinding crash that continues to wreak havoc on holdings and trading accounts. And everything suggests that the dramatic crash isn’t over.

Nonfarm payrolls: Testing the limits of Fed policy patience

The upcoming nonfarm payrolls report for May will provide the final update on the US labor market before Kevin Warsh attends his first policy meeting as the new Fed Chair later this month.

Recession on paper: What really moves the Canadian Loonie now?

Statistics Canada handed the headline writers a gift and the analysts a headache. Real GDP shrank 0.1% on an annualized basis in the first quarter, and with the fourth quarter of 2025 revised down to a 1.0% contraction, that is two negative quarters in a row, the textbook definition of a technical recession and Canada's first since the pandemic.