Bitcoin’s massive storm is back: Why the sell-off is far from over

Bitcoin price action over the last few weeks has felt less like a normal, healthy correction and more like a slow grinding crash that continues to wreak havoc on holdings and trading accounts. And everything suggests that the dramatic crash isn’t over.
From early February, when the Crypto King bottomed at $60,000, to mid-May, the steady price increase piggybacked on optimism for an imminent, lasting peace deal between the United States and Iran, as well as on growing institutional demand through Exchange-Traded Funds (ETFs).
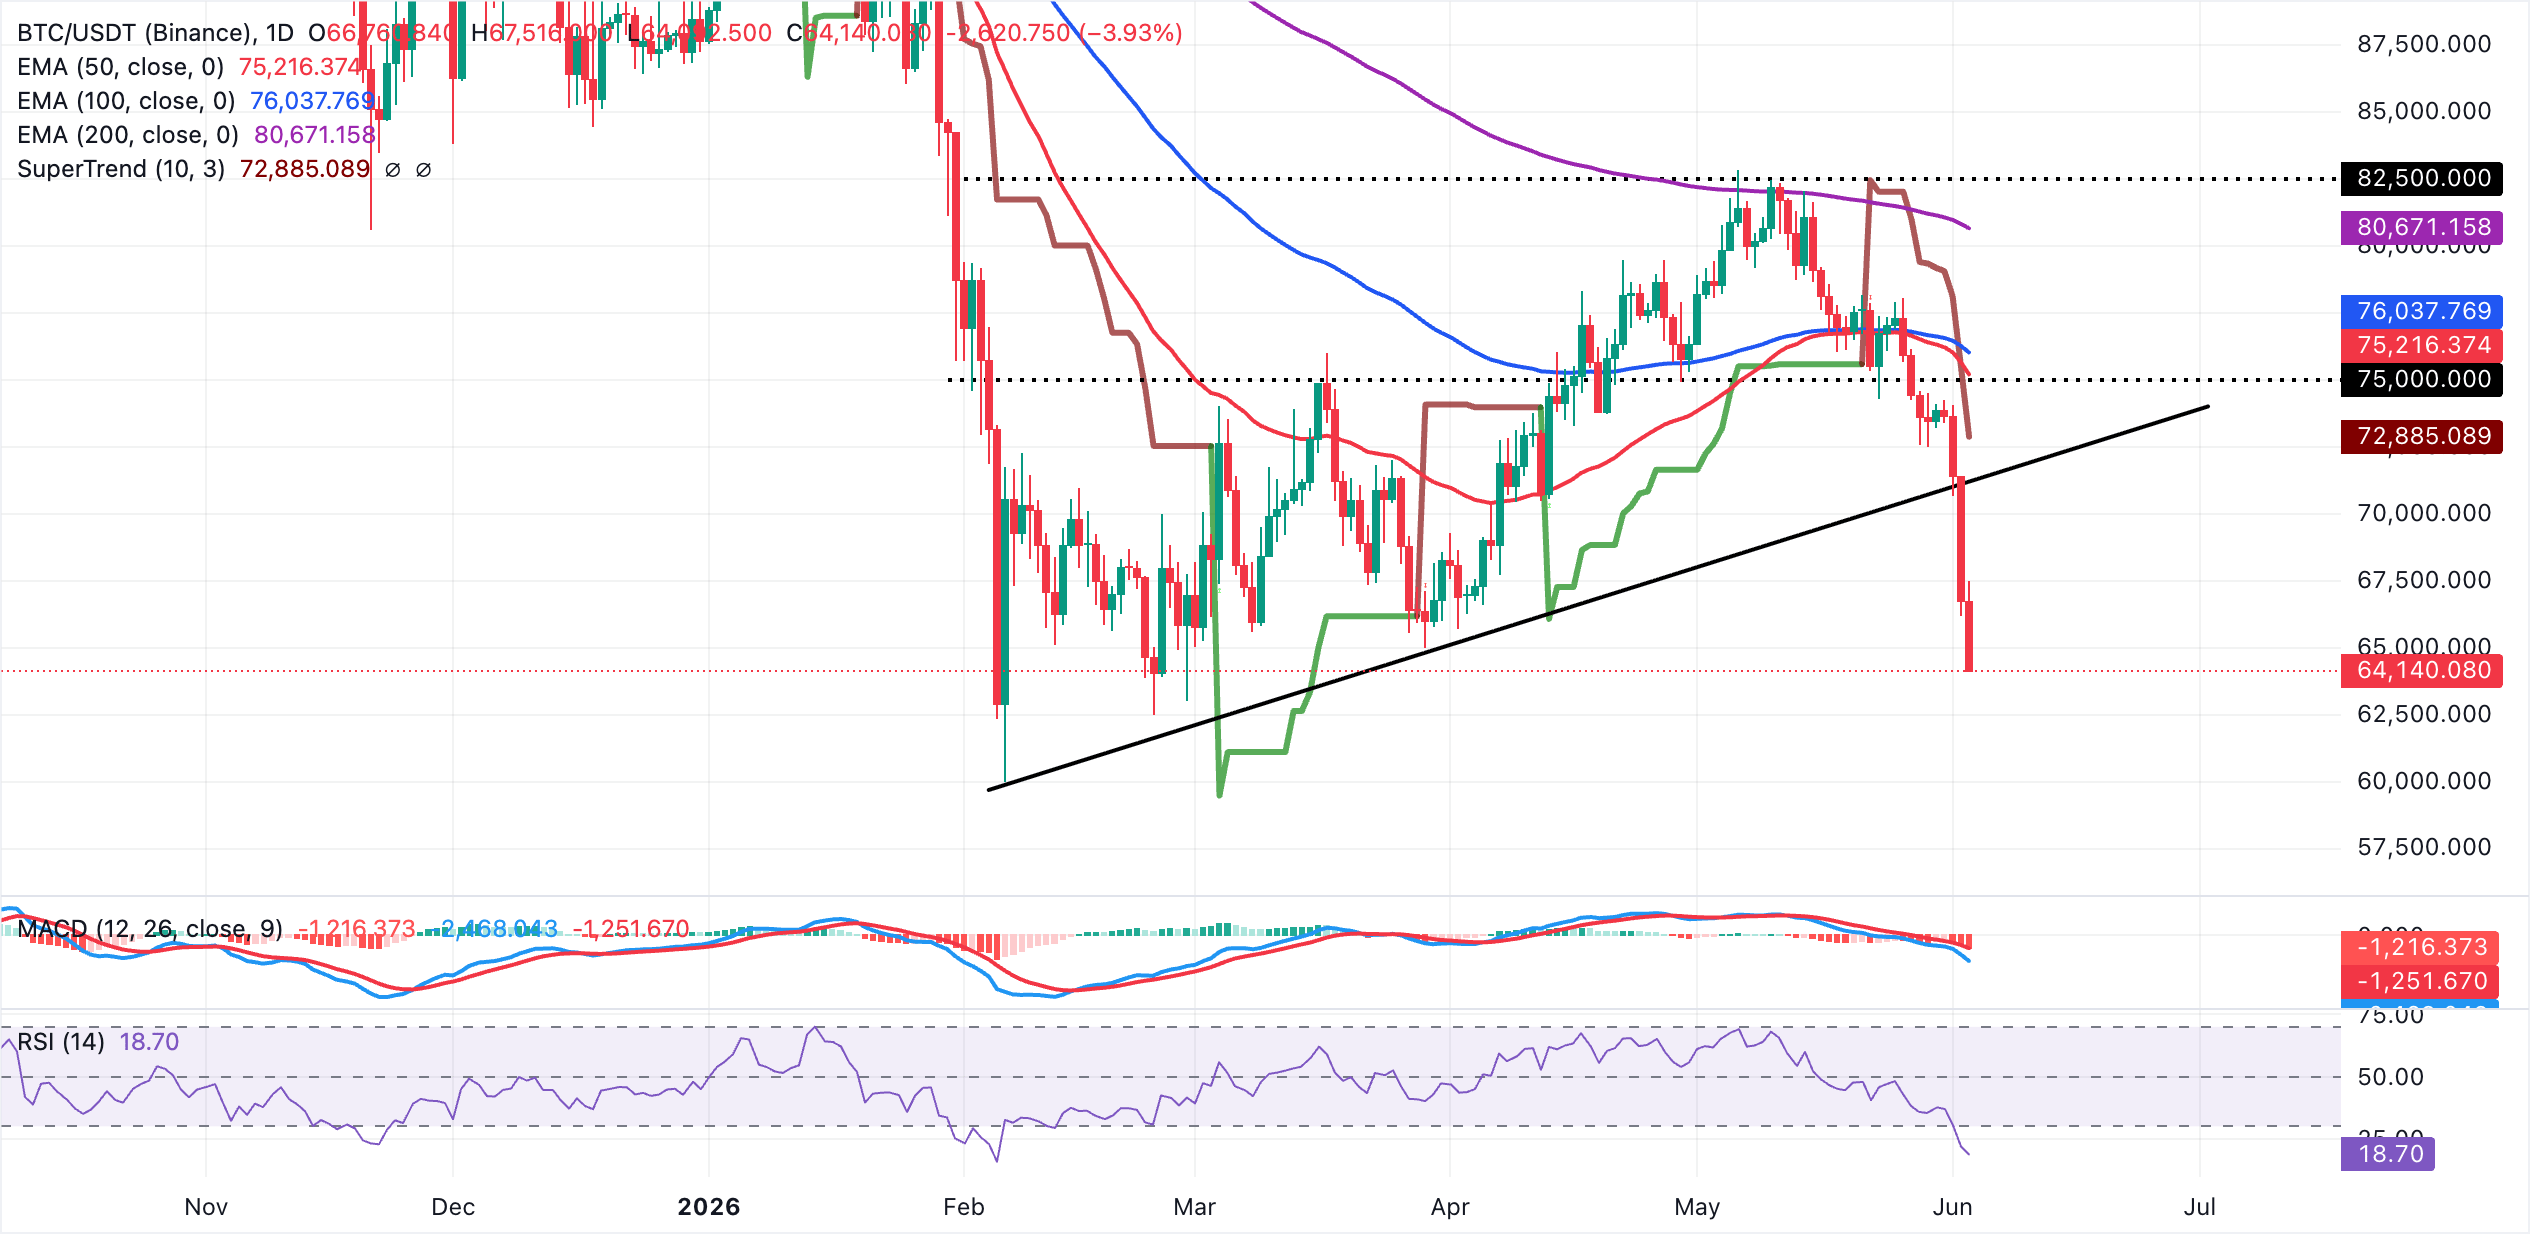
However, that veneer of invincibility has cracked, with Bitcoin’s dramatic crash from May’s peak of $82,822 to levels around $64,000 seemingly far from over. Anyone flirting with the idea that a local bottom is in, in my opinion, could be nursing a heavily battered portfolio.
Nevertheless, you can’t blame investors for wishing for a euphoric rally with no corrections, but that is rarely the case with Bitcoin. Especially with tensions escalating in the Middle East and inflation rising across major global economies, including the US.
Bitcoin is caught up in a classic macro-driven drawdown, and technical signals indicate a deeper sell-off is in the offing, targeting the psychological demand zone or line in the sand at $60,000.
Bitcoin sell-off: What is going on?
To comprehend Bitcoin’s downward momentum and its tight grip on the market, we have to look beyond the charts and examine all aspects, including macro and fundamental factors.
The institutional liquidity argument that propelled BTC in the early half of the year has narrowed significantly, evidenced by persistent capital outflows and a worrisome drop in inflows through Exchange-Traded Funds (ETFs) and derivatives.
Bitcoin ETFs have logged persistent withdrawals for four consecutive weeks, including $1 billion through May 15, $1.26 billion through May 22, $1.42 billion through May 29 and $1.40 billion through June 3.
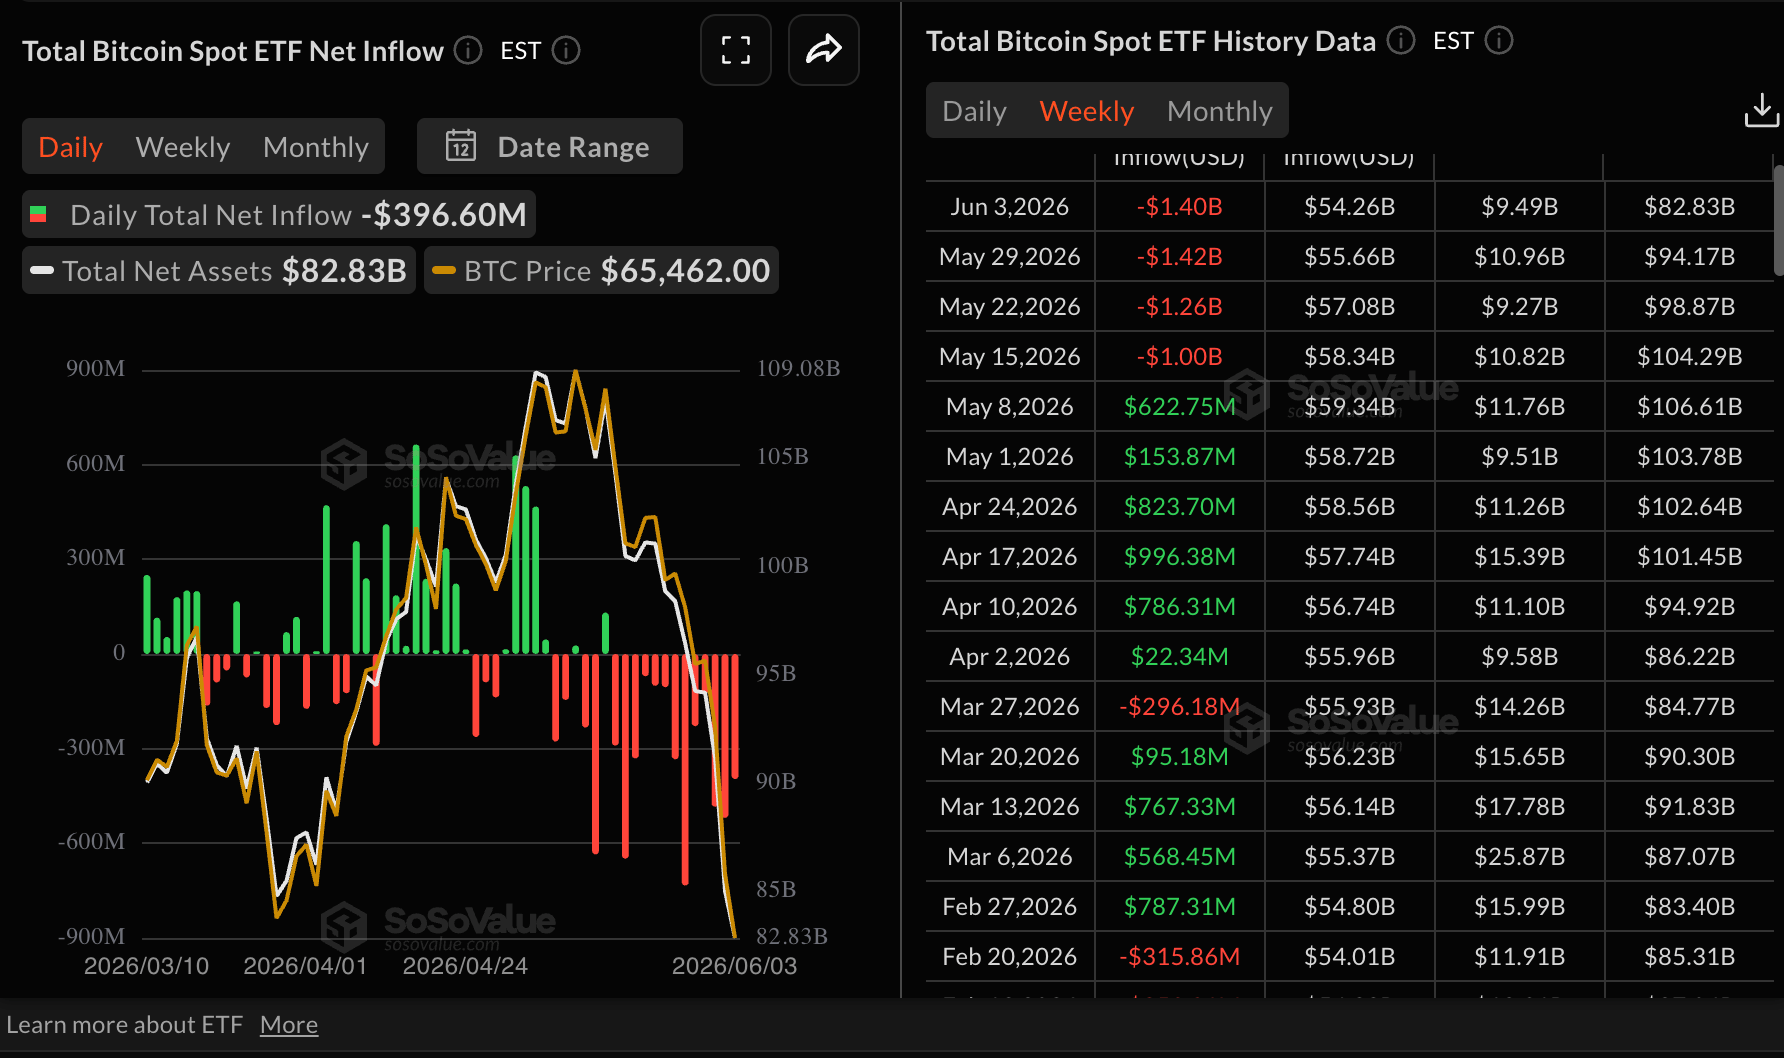
“Until we see a definitive week of net inflows, the burden of proof rests entirely with the bulls,” Bitfinex analysts told FXStreet.
Futures Open Interest (OI) remains on a strong downward spiral, averaging $51.37 billion on Thursday, down from $64.17 billion in early May. The current OI levels pale in comparison to the record $94.12 billion reached in October.
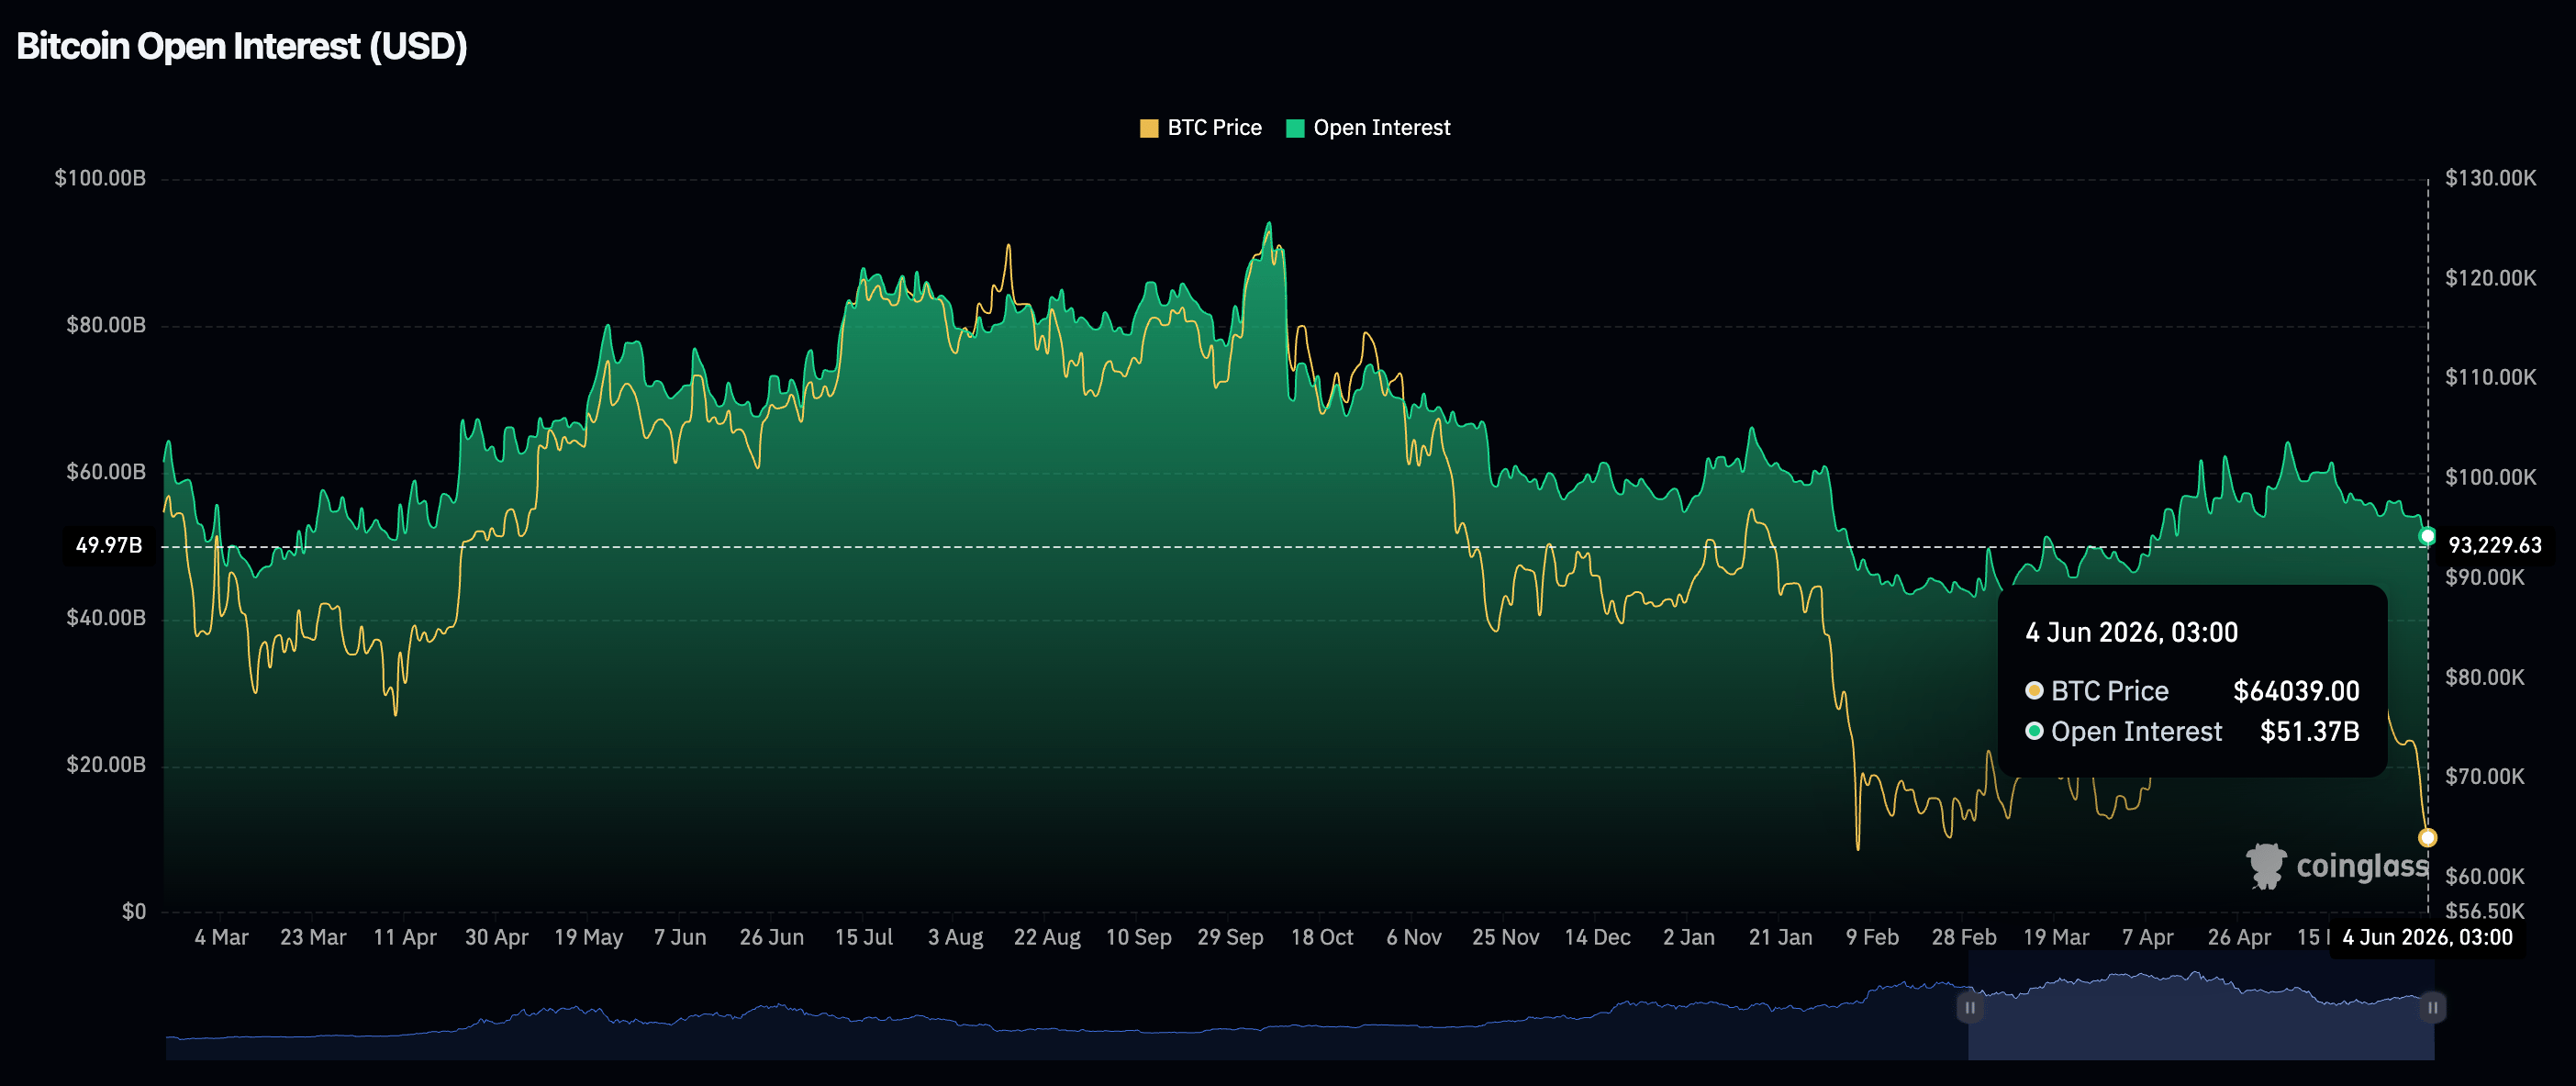
Bitfinex analysts explain that “funding rates were neutral-to-negative for the past week, suggesting this wasn’t a typical squeeze on an overcrowded long trade. Instead, spot-led selling and redemptions met thin order books, exacerbated by short-volatility carry trades that left dealers short gamma. This vacuum allowed the price to slide from $70,000 to $65,000 without meaningful absorption.”
The Wall Street narrative has taken a breather, and ETFs are bleeding out, reflecting a persistent risk-off mood that continues to spread into the retail market, leaving Bitcoin largely defenseless as traders shun opening new positions.
A weak derivatives market and nonexistent demand through ETFs significantly reduce Bitcoin’s capacity to absorb selling pressure. The sustained surge in ETF outflows has shifted the market dynamic from steady accumulation to pronounced institutional selling pressure, stripping the spot market of its core support.
Furthermore, the macro environment remains dangerously hostile to risk assets. Tensions in the Middle East are persistent, causing a sharp spike in risk-averse sentiment. This has intensified capital outflows from speculative assets, including crypto, into traditional assets such as Gold, bonds and the US Dollar (USD).
When geopolitical tensions escalate, the market often prioritizes liquidity over Bitcoin’s “digital Gold” narrative, underscoring risk-off behavior among investors.
The leverage effect, again
Bitfinex analysts pointed out that the “sell-off appears to be driven by a withdrawal of demand rather than supply-side capitulation.” Besides the ETF outflows, “the sellers behind this move are leveraged participants and mechanical treasury flows, while high-conviction holders have yet to show a distribution footprint.”
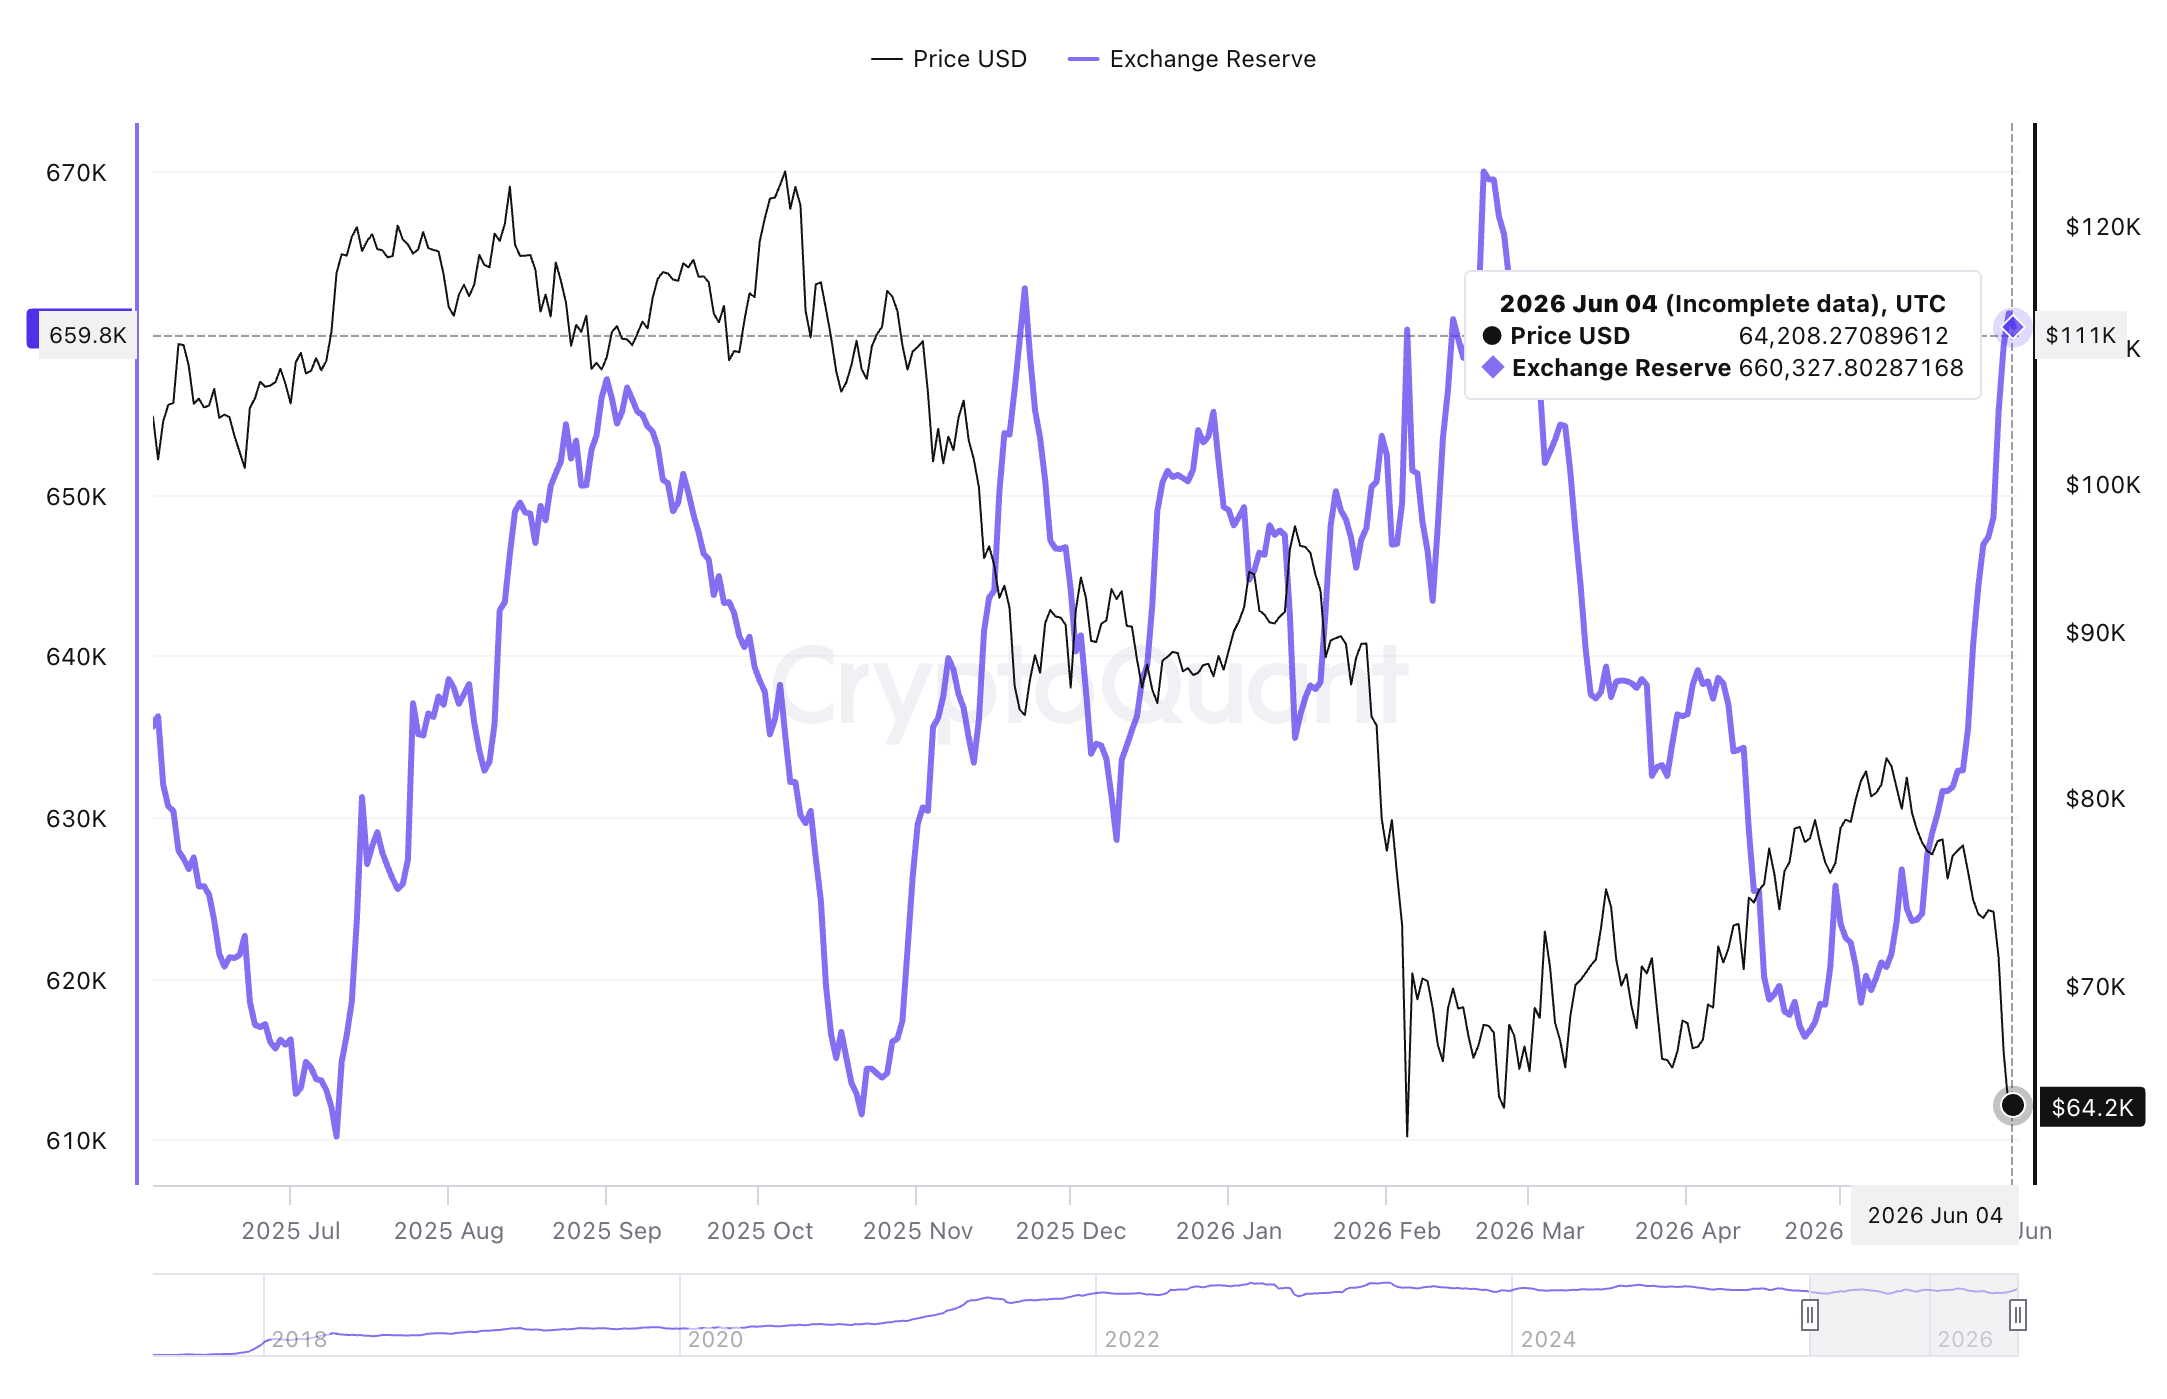
According to CryptoQuant data, Bitcoin Exchange Reserves on Binance hold slightly above 660,000 BTC, up from roughly 616,000 BTC. This increase shows that investors are transferring assets to exchange platforms, ready to sell as confidence in Bitcoin’s ability to sustain recovery fades.
Can the $60,000 floor hold Bitcoin?
This brings us to the vital question facing most market analysts and investors: Will the $60,000 mark a local market bottom, just as it did in early February, following the aggressive correction from the record high of $126,200?
The $60,000 highlights a recent support zone, where buyers re-engaged, increasing risk exposure through ETFs and derivatives, and marks dense on-chain realized price clusters where long-term holders previously stepped in and changed the course upwards.
Should Bitcoin adhere to its established market cycles, a sharp correction at this level could trigger a capitulation event among over-leveraged longs, ultimately paving the way for a more sustainable accumulation base.
However, I would strongly advise against relying on past occurrences, as history alone is not fundamentally a solid strategy. The $60,000 level acted as a springboard in February, but that breakout was supported by robust ETF inflows, a relatively calm macro environment, and hope for an imminent US-Iran peace deal after the war broke out. These factors are now notably absent, the US and Iran still exchanging fire and threatening the current, fragile ceasefire.
Bitcoin is currently defending the same critical support level amid, among other factors, narrowing demand, capital outflows, thin liquidity, geopolitical forces and macro uncertainty.
If the $60,000 demand area breaks under the overhanging weight of risk-off sentiment and panic selling, a technical trapdoor could open much wider, exposing investors to lower-liquidity pockets. Key levels to watch include $56,000 and $52,000, which served as support in September.
A bullish scenario would be in play if Bitcoin reclaims the pivotal $65,000 level as immediate support. Such a move, in my view, would need the support of capital inflows through ETFs, derivatives, on-chain positioning and a notable drop in Bitcoin’s exchange reserves.
I see Bitcoin approaching a cyclical inflection point. However, the final capitulatory flush is yet to come. Markets rarely bottom out as anticipated or in an orderly manner. They do so in waves of liquidity, paving the way for oversold conditions and fresh demand at lower entry points.
“Bitcoin tends to perform best when traders are positioned for the wrong outcome," Vitalii Bulynin, CEO at Versus Trade, says. “Right now, much of the market is still waiting for a major liquidity catalyst from the Fed. However, if that catalyst fails to arrive, Bitcoin may spend more time shaking out expectations than setting new highs,” he adds.
Market participants should watch the $60,000 region with discipline, looking for a clean, high-volume rejection of the level that would signal the entry of high-value buyers. On the contrary, a weak grinding consolidation would suggest that bears are still in control.
Bitcoin, altcoins, stablecoins FAQs
Bitcoin is the largest cryptocurrency by market capitalization, a virtual currency designed to serve as money. This form of payment cannot be controlled by any one person, group, or entity, which eliminates the need for third-party participation during financial transactions.
Altcoins are any cryptocurrency apart from Bitcoin, but some also regard Ethereum as a non-altcoin because it is from these two cryptocurrencies that forking happens. If this is true, then Litecoin is the first altcoin, forked from the Bitcoin protocol and, therefore, an “improved” version of it.
Stablecoins are cryptocurrencies designed to have a stable price, with their value backed by a reserve of the asset it represents. To achieve this, the value of any one stablecoin is pegged to a commodity or financial instrument, such as the US Dollar (USD), with its supply regulated by an algorithm or demand. The main goal of stablecoins is to provide an on/off-ramp for investors willing to trade and invest in cryptocurrencies. Stablecoins also allow investors to store value since cryptocurrencies, in general, are subject to volatility.
Bitcoin dominance is the ratio of Bitcoin's market capitalization to the total market capitalization of all cryptocurrencies combined. It provides a clear picture of Bitcoin’s interest among investors. A high BTC dominance typically happens before and during a bull run, in which investors resort to investing in relatively stable and high market capitalization cryptocurrency like Bitcoin. A drop in BTC dominance usually means that investors are moving their capital and/or profits to altcoins in a quest for higher returns, which usually triggers an explosion of altcoin rallies.
Author

John Isige
FXStreet
John Isige is a seasoned cryptocurrency journalist and markets analyst committed to delivering high-quality, actionable insights tailored to traders, investors, and crypto enthusiasts. He enjoys deep dives into emerging Web3 tren