|

Silver Price Analysis: XAG/USD recovers early lost ground to $23.00 area, lacks follow-through

  • Silver attracts dip-buying on Wednesday and stalls the overnight pullback from a two-week top.
  • The mixed technical setup warrants some caution for bullish traders ahead of the FOMC decision.
  • A sustained strength beyond the 200-day SMA should pave the way for additional near-term gains.

Silver reverses modest intraday losses to the $23.00 neighbourhood and turns neutral during the early European session on Wednesday, albeit lacks follow-through. The white metal currently trades around the $23.20 area, unchanged for the day, and for now, seems to have stalled its retracement slide from a nearly two-week high touched on Tuesday.

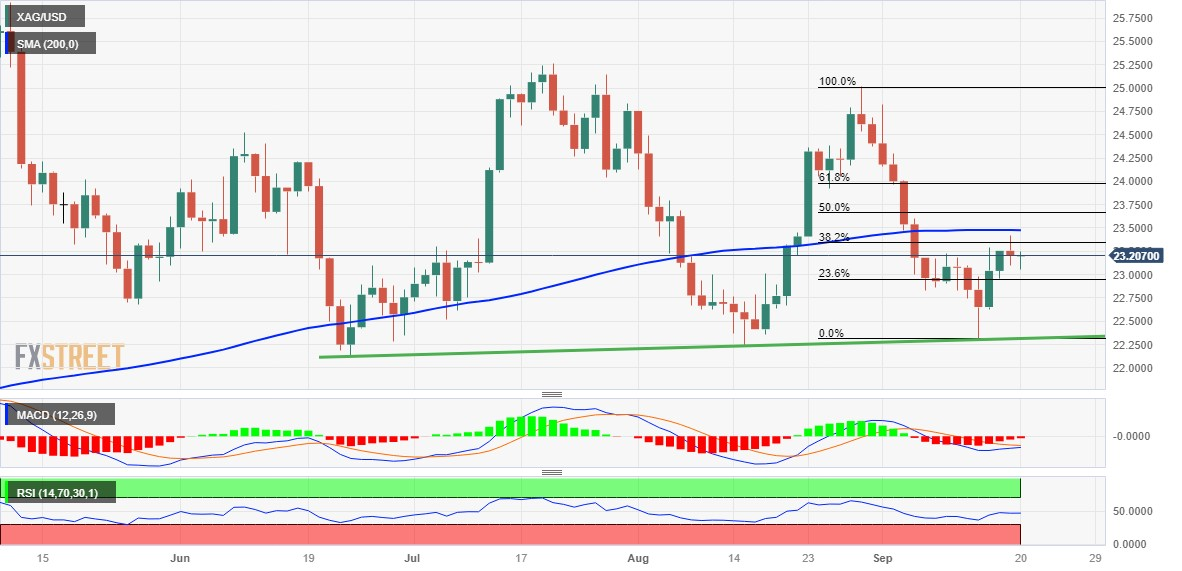
From a technical perspective, the recent goodish rebound from the $22.30 support area – representing an ascending trend line extending from the June monthly low – and the emergence of some dip-buying on Wednesday favours bullish traders. That said, the overnight failure to find acceptance above the 38.2% Fibonacci retracement level of the August-September fall and a pullback from the vicinity of the very important 200-day Simple Moving Average (SMA) warrants some caution.

Moreover, oscillators on the daily chart – though have been recovering from lower levels – are still far from confirming a positive bias. Hence, any subsequent move up might continue to attract fresh sellers and is more likely to remain capped near the 200-day SMA, currently pegged near the $23.40-$23.50 area. A sustained strength beyond, however, might prompt a short-covering rally and lift the XAG/USD to the 100-day SMA barrier, around the $23.80 region, en route to the $24.00 mark.

The next relevant hurdle is pegged near the $24.30-$24.35 region, which if cleared decisively should pave the way for a move towards reclaiming the $25.00 psychological mark. The latter coincides with the August monthly swing high and is followed by the July peak, around the $25.25 region. Some follow-through buying will be seen as a fresh trigger for bullish traders and pave the way for a further near-term appreciating move for the XAG/USD.

On the flip side, the daily trough, around the $23.05 area, now seems to protect the immediate downside, ahead of the 23.6% Fibo. level. Any further decline could find decent support near the $22.30 region, or a nearly one-month low touched last Thursday. Failure to defend the said support levels will confirm a bearish breakdown and make the XAG/USD vulnerable. The white metal could then accelerate the downward trajectory towards the next relevant support near the $21.25 zone before eventually dropping to the $21.00 round-figure mark.

Silver daily chart

fxsoriginal

Technical levels to watch

XAG/USD

Overview
Today last price23.2
Today Daily Change0.00
Today Daily Change %0.00
Today daily open23.2
 
Trends
Daily SMA2023.63
Daily SMA5023.74
Daily SMA10023.7
Daily SMA20023.48
 
Levels
Previous Daily High23.42
Previous Daily Low23.1
Previous Weekly High23.29
Previous Weekly Low22.3
Previous Monthly High25.02
Previous Monthly Low22.23
Daily Fibonacci 38.2%23.22
Daily Fibonacci 61.8%23.3
Daily Pivot Point S123.06
Daily Pivot Point S222.92
Daily Pivot Point S322.73
Daily Pivot Point R123.38
Daily Pivot Point R223.56
Daily Pivot Point R323.71

Author

Haresh Menghani

Haresh Menghani is a detail-oriented professional with 10+ years of extensive experience in analysing the global financial markets.

More from Haresh Menghani
Share:

Markets move fast. We move first.

Orange Juice Newsletter brings you expert driven insights - not headlines. Every day on your inbox.

By subscribing you agree to our Terms and conditions.

Editor's Picks

EUR/USD bears await break below 100-day SMA support near 1.1665 area

The EUR/USD pair attracts heavy selling for the second straight day and dives to a nearly four-week trough, around the 1.1670 region, during the Asian session on Monday. Bearish traders now await a sustained break below the 100-day Simple Moving Average before positioning for an extension of the recent pullback from a three-month top, or levels just above the 1.1800 mark touched on December 24.

GBP/USD falls toward 1.3400 near 50-day EMA

GBP/USD extends its losses for the second successive session, trading around 1.3420 during the Asian hours on Monday. The technical analysis of the daily chart indicates that the 14-day Relative Strength Index at 53 has eased from near overbought, indicating that momentum has cooled while remaining above the midline. RSI holds above 50, keeping a modest bullish bias.

Gold on fire at the start of the week on US-Venezuela tensions

Gold regains upside traction early Monday as flight to safety prevails on Venezuela turmoil. The US Dollar finds strong haven demand, caps Gold’s upside as focus shifts to US jobs data. Gold’s daily technical setup suggests that more upside remains in the offing.

Bulls firmly in control as Bitcoin breaks $93K, Ethereum and Ripple extend gains

Bitcoin, Ethereum, and Ripple extended their rallies on Monday, gaining more than 4%, 6%, and 12%, respectively, in the previous week. The top three cryptocurrencies by market capitalization could continue to outperform, with bulls in control of the momentum.

Economic outlook 2026-2027 in advanced countries: Solidity test

After a year marked by global economic resilience and ending on a note of optimism, 2026 looks promising and could be a year of solid economic performance. In our baseline scenario, we expect most of the supportive factors at work in 2025 to continue to play a role in 2026.

Meme Coins Price Prediction: Dogecoin, Shiba Inu, Pepe rally on Venezuela’s shadow BTC reserve

Meme coins such as Dogecoin, Shiba Inu, and Pepe are leading the cryptocurrency market rally driven by the US cross-border operation to capture Venezuelan President Nicolás Maduro. Dogecoin extends its gain for the fifth consecutive day while SHIB and PEPE take a pause.