|

Silver Price Analysis: XAG/USD rallies further beyond $27.00 mark, highest since late February

  • Silver gained strong positive traction on Thursday and surged past the $27.00 mark.
  • The technical set-up favours bullish traders and supports prospects for further gains.
  • Only a sustained break below the $26.00 mark will negate the near-term positive bias.

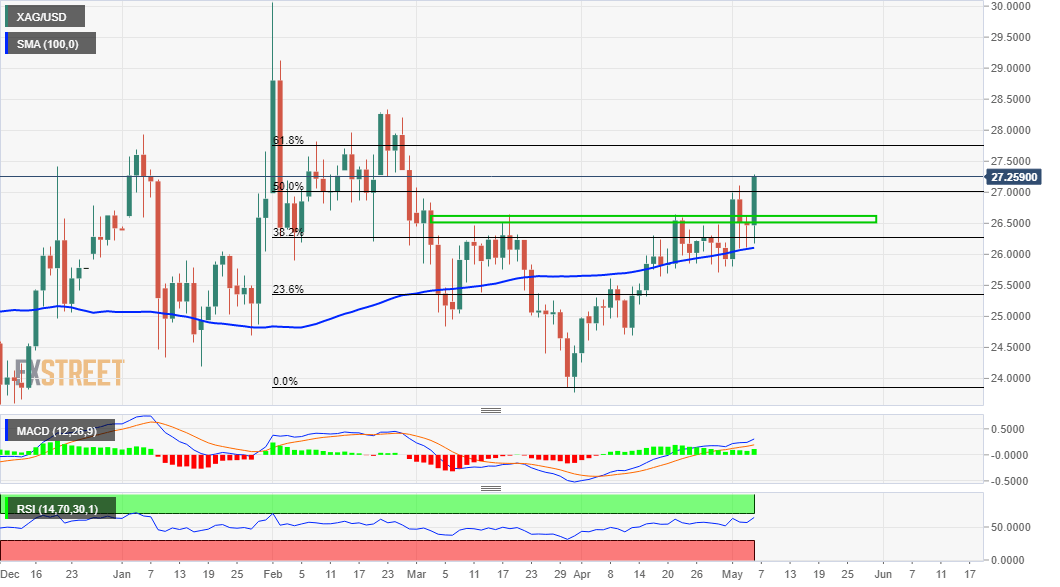
Silver caught some aggressive bids during the early North American session and surged to the highest level since February 26. The commodity was last seen trading around the $27.15-20 region, up around 2.5% for the day.

Given that the intra-week slide attracted dip-buying near the $26.00 mark, acceptance above the 50% Fibonacci level of the $30.07-$23.78 downfall might be seen as a fresh trigger for bullish traders. A subsequent strength beyond the $27.00 mark adds credence to the positive outlook and might have already set the stage for further gains.

The constructive set-up is reinforced by the fact that technical indicators on the daily chart have been gaining positive traction and are still far from being in the overbought territory. Hence, some follow-through strength towards the 61.8% Fibo. level, around the $$27.65-70 region, en-route the $28.00 mark, now looks a distinct possibility.

On the flip side, any meaningful pullback might now find decent support and bought into near the $26.60-50 congestion zone. This, in turn, should continue to help limit the downside near the $26.00 mark. The latter coincides with the 38.2% Fibo. level, which if broken decisively will negate the bullish bias and prompt some technical selling.

XAG/USD daily chart
fxsoriginal

Technical levels to watch

XAG/USD

Overview
Today last price27.16
Today Daily Change0.69
Today Daily Change %2.61
Today daily open26.47
 
Trends
Daily SMA2025.95
Daily SMA5025.8
Daily SMA10026.09
Daily SMA20025.59
 
Levels
Previous Daily High26.62
Previous Daily Low26.11
Previous Weekly High26.48
Previous Weekly Low25.71
Previous Monthly High26.64
Previous Monthly Low24.25
Daily Fibonacci 38.2%26.3
Daily Fibonacci 61.8%26.43
Daily Pivot Point S126.18
Daily Pivot Point S225.88
Daily Pivot Point S325.66
Daily Pivot Point R126.69
Daily Pivot Point R226.92
Daily Pivot Point R327.21

Author

Haresh Menghani

Haresh Menghani is a detail-oriented professional with 10+ years of extensive experience in analysing the global financial markets.


More from Haresh Menghani
Share:

Editor's Picks

AUD/USD remains offered around 0. 6950

AUD/USD has added to Wednesday’s decline, slipping back to the low 0.6900s just to grab some air afterwards and attempt a tepid bounce toward 0.6950 ahead of the opening bell in Asia on Friday. The Aussie’s extra weakness has come despite the Greenback receding modestly amid fresh improvement in the risk complex.

USD/JPY slips below 158.00 as USD retreats

USD/JPY returns to the red below 158.00 in the Asian session on Thursday amid speculation that authorities will step in to prop up the Japanese Yen. Meanwhile, the US Dollar eases from near an 18-month high on profit taking, ignoring Wednesday's hawkish FOMC Minutes and the risk of a further escalation of tensions in the Middle East, adding to the pair's pullback.

Gold clings to daily gains; still below $4,150

Gold regains some composure and climbs back to the vicinity $4,150 mark per troy ounce amid decent gains on Thursday. The yellow metal’s recovery follows some loss of momentum in the US Dollar strength and a decent drop in US Treasury yields across the curve.

XRP downtrend persists as EMA support strains while Binance reserves swell
Ripple (XRP) sellers are gaining ground on Thursday, as the token slips below $1.40. Sell-side pressure remains intense in the broader crypto market, as seen with leading digital assets, including Bitcoin (BTC) currently below $83,000 and Ethereum (ETH), sliding below $2,600. Despite the correction, XRP retains a constructive technical outlook, with support provided by a key moving average cluster.
Three fundamental drivers are all pushing the Euro south. This chart shows them lining up on 1.1000
EUR/USD has already fallen sharply, but the forces pushing the pair lower are becoming increasingly interconnected. French fiscal concerns, renewed energy pressure and an uncomfortable policy dilemma for the European Central Bank (ECB) are colliding with a US economy that continues to give the Federal Reserve (Fed) little reason to turn dovish.
The UK 30-year gilt just hit a 1998 high. Is that good or bad for the British Pound?
The yield on the UK's 30-year government bond, or gilt, went through 6% on October 1 for the first time since early 1998, and on Monday the Pound was at its strongest against the Euro since June 2025. The gilt market's 28-year high is mostly someone else's. Since early May, the 30-year gilt yield has risen about 0.15 of a percentage point and the US 30-year about 0.7.