|

Silver Price Analysis: XAG/USD price retreats below $23.00 as double-top looms

  • Silver is facing a potential double-top formation on the daily chart suggests further retracement is possible.
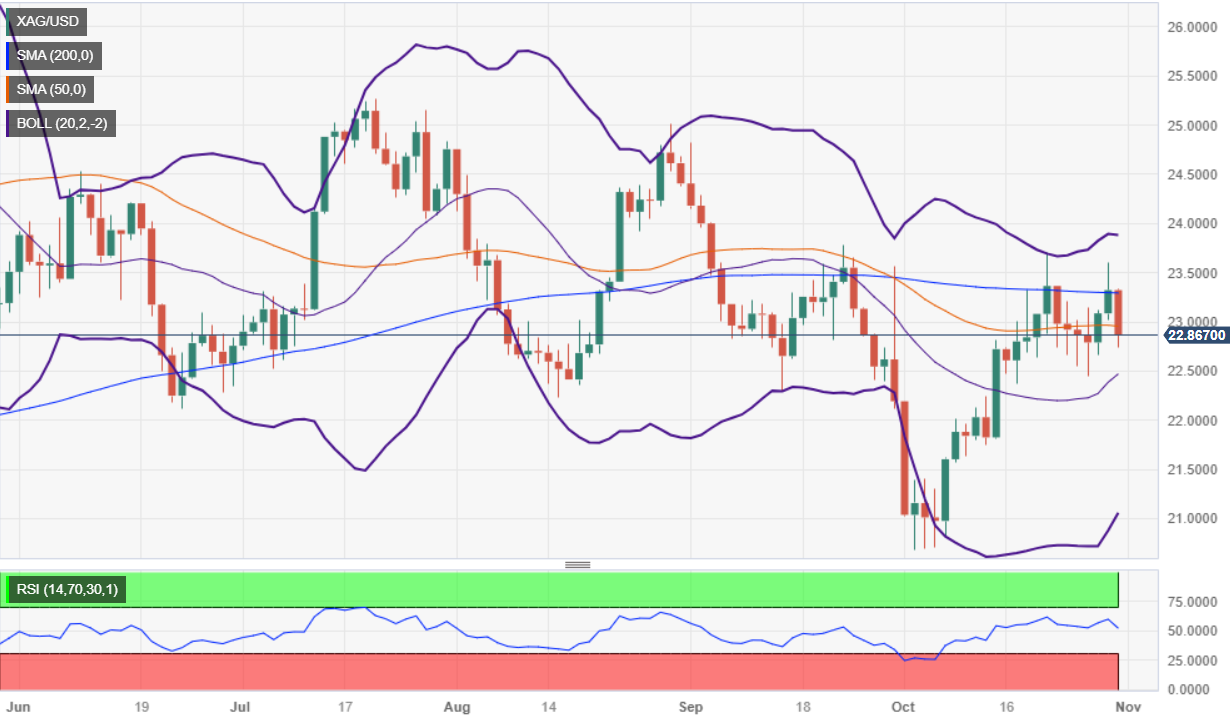
  • Key support levels include the 50-day moving average (DMA) at $22.93 and the 20-day DMA at $22.45.
  • On the upside, reclaiming $23.00 would bring the 200-DMA at $23.28 into focus, followed by the September 23 daily high at $23.77.

Silver price trips down and aims below the $23.00 mark, which was briefly visited by the grey metal and capped by a strong recovery from the Greenback. The XAG/USD is trading at $22.86, down 1.82%.

A double-top in the daily chart is forming, suggesting that XAG/USD could retrace further, past the latest cycle low of $22.45, the October 26 low. However, on its way to challenging the latter, Silver must break key technical support levels like the 50-day moving average (DMA) at 422.93, and the 20-day moving average (DMA) at $22.45. Once those levels are cleared, Silver could shift from a neutral to a downward bias.

Conversely, if XAG/USD stays above the 50-DMA and reclaims $23.00, the following resistance level would be the 200-DMA at $23.28, which needs to be cleared, along with the September 23 daily high at $23.77, the latest cycle high, to shift the grey-metal bias to upwards. In that outcome, the XAG/USD next resistance would be $24.00.

XAG/USD Price Action – Daily chart

XAG/USD Technical Levels

XAG/USD

Overview
Today last price22.87
Today Daily Change-0.45
Today Daily Change %-1.93
Today daily open23.32
 
Trends
Daily SMA2022.39
Daily SMA5022.97
Daily SMA10023.24
Daily SMA20023.3
 
Levels
Previous Daily High23.61
Previous Daily Low23.02
Previous Weekly High23.36
Previous Weekly Low22.44
Previous Monthly High24.82
Previous Monthly Low22.12
Daily Fibonacci 38.2%23.38
Daily Fibonacci 61.8%23.24
Daily Pivot Point S123.03
Daily Pivot Point S222.73
Daily Pivot Point S322.44
Daily Pivot Point R123.61
Daily Pivot Point R223.91
Daily Pivot Point R324.2

Author

Christian Borjon Valencia

Markets analyst, news editor, and trading instructor with over 14 years of experience across FX, commodities, US equity indices, and global macro markets.

More from Christian Borjon Valencia
Share:

Editor's Picks

EUR/USD falls to near 1.1600 due to persistent bearish bias

EUR/USD depreciates after registering modest gains in the previous session, trading around 1.1610 during the Asian hours on Thursday. The technical analysis of the daily chart suggests a persistent bearish bias as the EUR/USD pair remains within the descending channel pattern.

GBP/USD underperforms as UK faces stagflation risks amid Middle East war

The Pound Sterling trades lower against its major currency peers, is down 0.22% around 1.3340 against the US Dollar, during the Asian trade on Thursday. The British currency faces selling pressures amid fears that the United Kingdom economy could face stagflation risks due to higher energy prices, a situation in which inflation accelerates with economic growth and employment conditions remaining stagnant.

Gold climbs near $5,200 as Iran war fuels safe-haven demand

Gold price extends its gains for the second successive session on Thursday as traders seek safety amid the ongoing war in the Middle East. US and Israeli strikes across Iranian territory and widespread Iranian missile and drone retaliation across the Middle East, including attacks on regional targets and military sites, prolong the crisis and its impact.

Top Crypto Gainers: Decred, Zcash, and Dogecoin lead recovery as Bitcoin crosses $72,000

Bitcoin trades above $72,500 at press time on Thursday, holding its 6% gain from the previous day, contributing to a broader market recovery. The total cryptocurrency market capitalization stands at over $2.43 trillion as the broader market sentiment improves significantly.

First Venezuela, now Iran: The US-China energy war escalates

At first glance, the latest escalation involving the United States with both Iran and Venezuela looks like another chapter in a long-running geopolitical story. But viewed through a broader strategic lens, something else may be unfolding: Energy.

Cardano Price Analysis: Approaches key trendline amid bearish sentiment

Cardano (ADA) price is approaching its descending trendline around $0.28 at the time of writing, set to shape the next directional move. The derivatives metrics paint a bearish picture, with ADA’s Open Interest continuing to fall and short bets rising among traders.