Silver Price Analysis: XAG/USD hangs near weekly lows, just above mid-$27.00s
- Silver was seen hovering near the lower boundary of its weekly trading range.
- Neutral oscillators on the daily charts warrant some caution for bearish traders.
- Sustained weakness below the $27.00 mark is needed to confirm a breakdown.

Silver remained on the defensive through the first half of the trading action on Wednesday and was last seen hovering near weekly lows, just above mid-$27.00s.
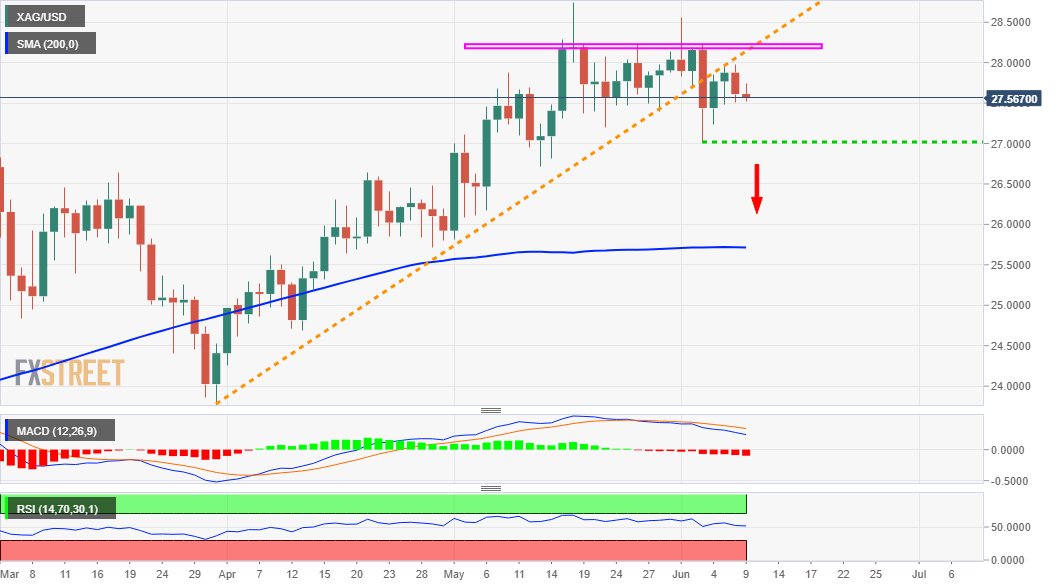
From a technical perspective, the recent bounce from three-week lows faltered near the $28.00 mark on Tuesday. The mentioned handle marks an ascending trend-line support breakpoint – extending from YTD lows touched in March – and should now act as a key pivotal point for short-term traders.
Meanwhile, oscillators on the daily chart – though have been losing positive momentum – are yet to confirm a bearish bias and warrant some caution before positioning for any further decline. Hence, any subsequent decline might continue to find decent support near the $27.00 mark and remain limited.
That said, a convincing break below will mark a fresh breakdown and turn the XAG/USD vulnerable. The next relevant support is pegged near the $26.60 resistance breakpoint ahead of the $26.00 mark and the very important 200-day SMA. The latter is currently pegged near the $25.75-70 region.
On the flip side, the $27.90-$28.00 region now seems to have emerged as an immediate strong hurdle and is closely followed by the $28.25-30 supply zone. Sustained strength beyond will negate the negative bias and push the XAG/USD back towards monthly tops, around the $28.75 region.
Some follow-through buying should pave the way for a move beyond the $29.00 mark, towards the $29.60 resistance zone en-route the $30.00 psychological mark, or multi-year tops touched in February.
XAG/USD daily chart
Technical levels to watch
Author

Haresh Menghani
FXStreet
Haresh Menghani is a detail-oriented professional with 10+ years of extensive experience in analysing the global financial markets.
















