|

Silver Price Analysis: XAG/USD flirts with 100-period SMA on H4, 23.6% Fibo. holds the key

  • Silver drifts lower for the second straight day, though defends 100-period SMA on the 4-hour chart.
  • The mixed oscillators on hourly/daily charts warrant some caution before placing aggressive bets.
  • A sustained weakness below the $24.40-30 area is needed to support prospects for deeper losses.

Silver remains under some selling pressure for the second successive day on Monday and drops to a three-day low, around the $24.80-$24.75 region heading into the European session.

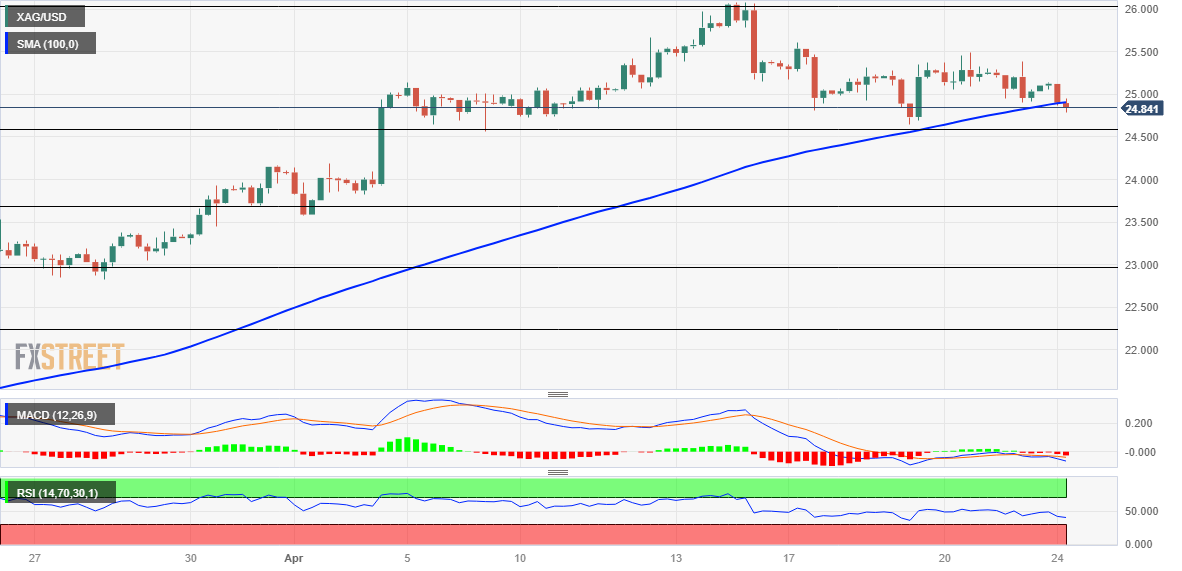
From a technical perspective, the XAG/USD, so far, has managed to defend the 100-period Simple Moving Average (SMA) on the 4-hour chart. This is closely followed by the 23.6% Fibonacci retracement level of the March-April rally, around the $24.65 zone and the $24.40-$24.30 strong horizontal resistance breakpoint, now turned support.

With oscillators on hourly charts holding deep in the negative territory, a convincing break below the latter will set the stage for an extension of the recent pullback from a yearly peak, around the $26.10 region touched on April 14. The XAG/USD might then weaken further below the $24.00 mark and test the 38.2% Fibo. level, around the $23.70 area.

On the flip side, any intraday positive move back above the $25.00 psychological mark now seems to confront some resistance near the $25.20 horizontal level ahead of the $25.50-$25.60 supply zone. A sustained strength beyond will negate the negative bias and allow the XAG/USD to make a fresh attempt to conquer the $26.00 round-figure mark.

Some follow-through buying will mark a fresh bullish breakout and set the stage for a further near-term appreciating move. The next relevant hurdle is pegged near the $26.25-$26.30 region, above which the XAG/USD could aim to reclaim the $27.00 round-figure mark.

Silver 4-hour chart

fxsoriginal

Key levels to watch

XAG/USD

Overview
Today last price24.88
Today Daily Change-0.22
Today Daily Change %-0.88
Today daily open25.1
 
Trends
Daily SMA2024.62
Daily SMA5022.75
Daily SMA10023.1
Daily SMA20021.41
 
Levels
Previous Daily High25.39
Previous Daily Low24.9
Previous Weekly High25.6
Previous Weekly Low24.64
Previous Monthly High24.16
Previous Monthly Low19.9
Daily Fibonacci 38.2%25.09
Daily Fibonacci 61.8%25.2
Daily Pivot Point S124.87
Daily Pivot Point S224.65
Daily Pivot Point S324.39
Daily Pivot Point R125.36
Daily Pivot Point R225.62
Daily Pivot Point R325.85

Author

Haresh Menghani

Haresh Menghani is a detail-oriented professional with 10+ years of extensive experience in analysing the global financial markets.

More from Haresh Menghani
Share:

Markets move fast. We move first.

Orange Juice Newsletter brings you expert driven insights - not headlines. Every day on your inbox.

By subscribing you agree to our Terms and conditions.

Editor's Picks

EUR/USD rebounds after falling toward 1.1700

EUR/USD gains traction and trades above 1.1730 in the American session, looking to end the week virtually unchanged. The bullish opening in Wall Street makes it difficult for the US Dollar to preserve its recovery momentum and helps the pair rebound heading into the weekend.

GBP/USD steadies below 1.3400 as traders assess BoE policy outlook

Following Thursday's volatile session, GBP/USD moves sideways below 1.3400 on Friday. Investors reassess the Bank of England's policy oıtlook after the MPC decided to cut the interest rate by 25 bps by a slim margin. Meanwhile, the improving risk mood helps the pair hold its ground.

Gold stays below $4,350, looks to post small weekly gains

Gold struggles to gather recovery momentum and stays below $4,350 in the second half of the day on Friday, as the benchmark 10-year US Treasury bond yield edges higher. Nevertheless, the precious metal remains on track to end the week with modest gains as markets gear up for the holiday season.

Crypto Today: Bitcoin, Ethereum, XRP rebound amid bearish market conditions

Bitcoin (BTC) is edging higher, trading above $88,000 at the time of writing on Monday. Altcoins, including Ethereum (ETH) and Ripple (XRP), are following in BTC’s footsteps, experiencing relief rebounds following a volatile week.

How much can one month of soft inflation change the Fed’s mind?

One month of softer inflation data is rarely enough to shift Federal Reserve policy on its own, but in a market highly sensitive to every data point, even a single reading can reshape expectations. November’s inflation report offered a welcome sign of cooling price pressures. 

XRP rebounds amid ETF inflows and declining retail demand demand

XRP rebounds as bulls target a short-term breakout above $2.00 on Friday. XRP ETFs record the highest inflow since December 8, signaling growing institutional appetite.