|

Silver Price Analysis: XAG/USD falls after clashing at $24.00, weighed by technical factors, strong USD

  • Silver prices dropped after testing weekly highs of $24.00, impacted by rising US bond yields.
  • Bullish momentum was curbed by the strong US Dollar and significant resistance at the $24.00 area, according to technical indicators.
  • Downward bias confirmed by bearish Relative Strength Index (RSI) and three-day Rate of Change (RoC).

Silver price dropped after testing weekly highs of $24.00, and retraces weighed due to elevated US bond yields, strong US Dollar (USD), and technical indicators. The XAG/USD exchanges hands at around $23.40s after hitting a weekly high of $24.05.

XAG/USD Price Analysis: Technical outlook

XAG/USD remains neutral-to-downward biased, unable to break decisively above the $24.00 mark area. Technical indicators, like the 50- and 20-day Exponential Moving Averages (EMAs) confluence at $23.71-$23.87, dragged Silver’s spot price lower.

Furthermore, the Relative Strength Index (RSI) indicator and the three-day Rate of Change (RoC) portray that sellers are in charge, both at bearish territory warrant downward action.

Therefore, the XAG/USD first support would be the current week’s low at $23.25, which, once cleared, the white metal could extend its losses toward the $23.00 figure. If XAG/USD slides further will challenge the 200-day EMA at $22.87.

Otherwise, the XAG/USD resistance area would be the abovementioned confluence of the 20/50-day EMAs, at around $23.71-$23.87, which, once breached, could spark a test of $24.00. if XAG/USD clears that area, the next supply zone would be the $25.00 mark.

XAG/USD Price Action – Daily chart
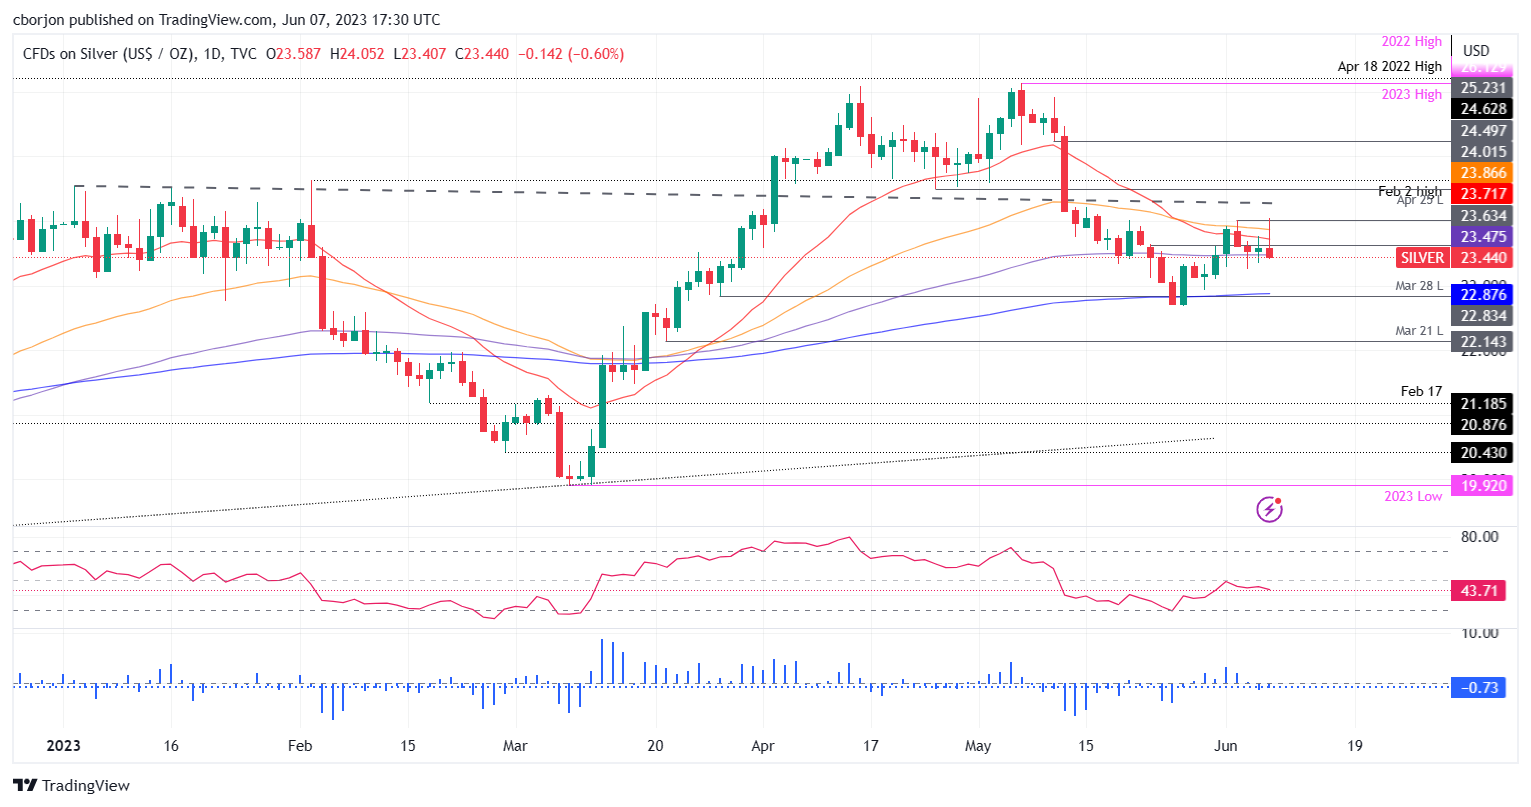
XAG/USD Daily chart

XAG/USD

Overview
Today last price23.44
Today Daily Change-0.16
Today Daily Change %-0.68
Today daily open23.6
 
Trends
Daily SMA2023.66
Daily SMA5024.47
Daily SMA10023.34
Daily SMA20022.17
 
Levels
Previous Daily High23.78
Previous Daily Low23.34
Previous Weekly High24.02
Previous Weekly Low22.93
Previous Monthly High26.14
Previous Monthly Low22.68
Daily Fibonacci 38.2%23.61
Daily Fibonacci 61.8%23.51
Daily Pivot Point S123.36
Daily Pivot Point S223.13
Daily Pivot Point S322.93
Daily Pivot Point R123.8
Daily Pivot Point R224.01
Daily Pivot Point R324.24

Author

Christian Borjon Valencia

Markets analyst, news editor, and trading instructor with over 14 years of experience across FX, commodities, US equity indices, and global macro markets.


More from Christian Borjon Valencia
Share:

Editor's Picks

GBP/USD keeps the bid bias near 1.3550

GBP/USD leaves behind part of the recent three-day retracement and hovers around the 1.3550 region on Monday. The Greenback’s fresh downward trend helps Cable and the rest of the risk complex recoup part of the recent ground lost while attention remains on the potential Fed rate path.

EUR/USD reclaims 1.1600 and beyond

EUR/USD keeps pushing harder on Monday, this time surpassing the key 1.1600 hurdle. The pair’s rebound comes as the selling pressure on the US Dollar has been gathering further traction in the last few hours, at the time when investors continue to assess the likelihood of a Fed rate hike in September.

Gold trims losses; focus is back to $4,450

Gold adds to Friday’s marked decline, although it has managed to bounce off earlier lows in the sub-$4,400 region per troy ounce on Monday. The yellow metal’s pullback comes despite the softer stance in the US Dollar and steady uncertainty in the Middle East, although rising yields keep bulls at bay for now.

Crypto Today: Bitcoin, Ethereum, XRP broadly consolidate amid renewed US-Iran strikes

Bitcoin remains resilient above $78,000 as investors anticipate a renewed push toward $80,000. Ethereum continues to demonstrate a constructive technical setup, holding above $2,400. Ripple is exhibiting early signs of recovery near $1.37.

Oil rallies on fresh persian gulf strikes
Energy prices are trading firmer this morning after the US carried out targeted strikes against Iran, drawing retaliatory strikes and reinforcing concerns about a prolonged stalemate in the Persian Gulf. Oil prices started the week stronger following the first military strikes between the US and Iran in a month. ICE Brent briefly moved back above US$90/bbl in early morning Asia trading.
Diesel’s record $100 warning: The oil shock hiding in plain sight

The Oil market may look calmer than it did a few months ago, but diesel is sending a very different message. The US diesel crack spread, the premium of ultra-low sulphur diesel futures over WTI, recently surged above $100 per barrel for the first time, reaching an intraday record of just over $102.00.














