|

Silver Price Analysis: XAG/USD breaks below the 200-DMA, extends its fall below $21.90

  • Silver price stumbles below the 200-day EMA at $21.95, shifting its bias to neutral-downwards.
  • XAG/USD Price Analysis: Shifted neutral-to-downwards, though two more closes below the 200-DMA would cement its downward bias.

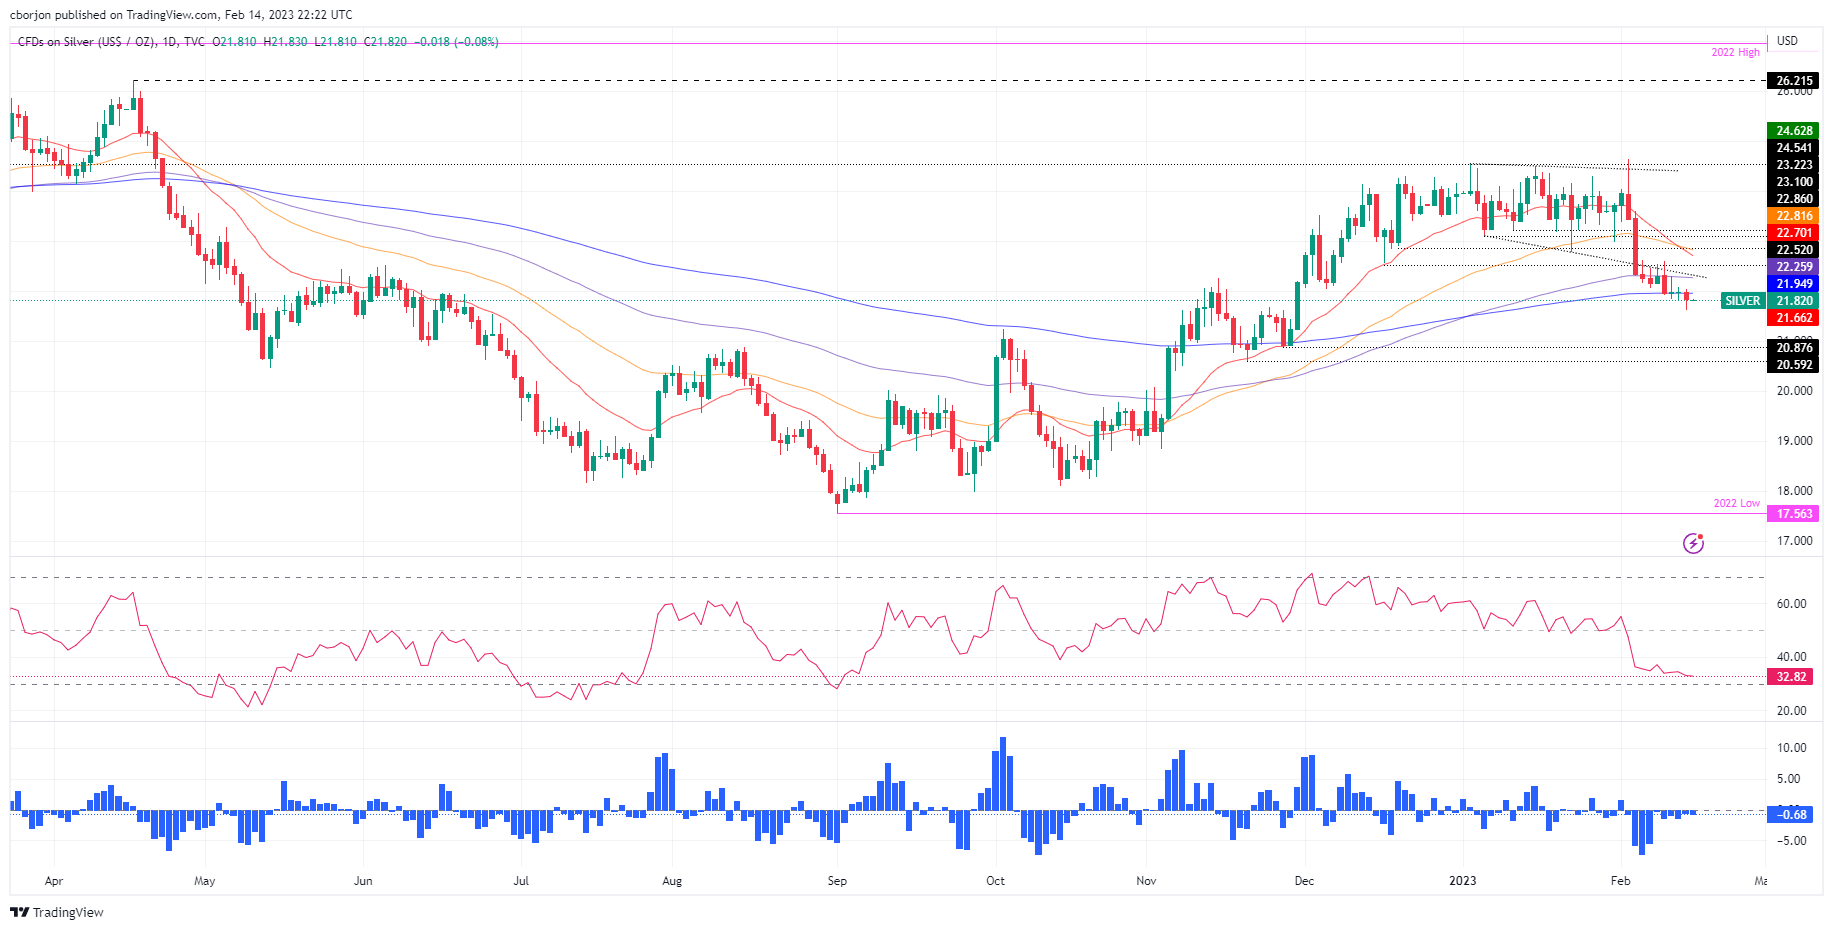
Silver price continues to trade beneath the bottom-trendline of a megaphone formation and below the 200-day Exponential Moving Average (EMA) at 21.95, a bearish signal for the white metal. It should be said that a daily close below the latter would pave the way for further downside. At the time of writing, XAG/USD exchanges hands at $21.84 a troy ounce after hitting a daily high of $22.03.

After dropping below the bottom-trendline of a megaphone formation, the XAG/USD has failed to regain the $22.50 mark and exposed the 200-day EMA. A daily close is needed to further cement a change on the neutral bias to neutral-downwards, and it will expose untested support areas since December of 2022.

If that scenario plays out, the XAG/USD first support would be the November 28 daily low of $20.87, followed by the November 21 swing low of $20.59. Once cleared, the psychological level of $20.00 would be up for grabs.

In an alternate scenario, the XAG/USD first resistance would be the 200-day EMA at $21.94, ahead of the $22.00 figure. Once broken, Silver could aim inside the megaphone formation, but firstly it needs to crack the bottom trendline at $22.20.

It should be said that oscillators like the Relative Strength Index (RSI) suggest a bearish continuation, but the Rate of Change (RoC), confirms that sellers are losing momentum. Hence, the XAG/USD might consolidate around the $21.60-$22.00 area, awaiting a fresh catalyst before determining its direction.

XAG/USD Daily chart
XAG/USD Key technical levels

XAG/USD

Overview
Today last price21.85
Today Daily Change-0.12
Today Daily Change %-0.55
Today daily open21.97
 
Trends
Daily SMA2023.17
Daily SMA5023.43
Daily SMA10021.86
Daily SMA20021
 
Levels
Previous Daily High22.08
Previous Daily Low21.79
Previous Weekly High22.62
Previous Weekly Low21.84
Previous Monthly High24.55
Previous Monthly Low22.76
Daily Fibonacci 38.2%21.9
Daily Fibonacci 61.8%21.97
Daily Pivot Point S121.82
Daily Pivot Point S221.66
Daily Pivot Point S321.53
Daily Pivot Point R122.11
Daily Pivot Point R222.24
Daily Pivot Point R322.4

Author

Christian Borjon Valencia

Markets analyst, news editor, and trading instructor with over 14 years of experience across FX, commodities, US equity indices, and global macro markets.


More from Christian Borjon Valencia
Share:

Editor's Picks

AUD/USD keeps range near mid-0.7100s as USD bulls await US CPI

AUD/USD steadies near mid-0.7100s in the Asian session on Friday, stalling the previous day's sharp decline to an over one-week low. The August PPI report reaffirmed Fed rate-hike bets and boosted the US Dollar on Thursday, which weighed heavily on the pair. However, hawkish RBA expectations limited losses for the Aussie as USD bulls now await the release of the US consumer inflation figures before placing fresh bets.

USD/JPY holds lower ground toward 154.00; looks to US CPI

USD/JPY holds lower ground toward 154.00 in the Asian session on Friday after hot Japanese PPI data bolster a more hawkish BoJ repricing and provide fresh impetus to the Japanese Yen. However, the downside appears capped as the US Dollar preserves overnight gains ahead of the latest US consumer inflation data.

Gold: Gains remain capped by $4,400

Gold regains composure and trades with decent gains on Friday, managing to refocus attention on the $4,440 mark per ounce troy. Therefore, the precious metal reverses Thursday’s decline as the US Dollar alternates gains with losses at the end of the week.

Ripple Price Forecast: XRP extends decline as returning ETF inflows fail to lift outlook
Ripple (XRP) falls below $1.33 on Friday, marking the third consecutive day of declines. The token continues to track the broader cryptocurrency market downturn, with investors closely monitoring heightened macroeconomic uncertainty ahead of the United States (US) Consumer Price Index (CPI) release and next week’s Federal Reserve (Fed) monetary policy decision.
Weekly focus – The hawks set the tone
Risky assets came under pressure this week as energy prices kept creeping higher and the ECB surprised the markets with a hawkish tone. The price of Brent crude touched USD 110 per barrel on Thursday night, highest since mid-May, as news emerged that the Yemeni Houthis had reached control of key port cities and islands near the Bab el-Mandeb strait.
Venezuela’s 65-billion-barrel Oil deal could reshape America’s inflation fight
The United States (US) has secured unprecedented access to part of Venezuela’s vast Oil reserves. The timing is particularly significant as the war with Iran is disrupting Middle Eastern supplies, keeping energy prices elevated and reviving concerns about inflation.














