Silver Price Analysis: XAG/USD bounces off seven-week low on the way to $22.00
- Silver prints corrective pullback from multiday low, bears keep reins.
- Sustained break of 61.8% Fibonacci retracement, weekly resistance line join bearish MACD signals to favor sellers.
- 50-DMA adds to the upside filters, yearly low can lure bears past $22.00.

Silver (XAG/USD) licks its wounds near the lowest levels since mid-October during the early Asian session on Tuesday. That said, the quote eyes to regain $23.00 by the press time.
The bright metal refreshed multi-day low the previous day after breaking the 61.8% Fibonacci retracement (Fibo.) of September-November downside. The corrective pullback could be linked to multiple supports marked since late August.
In addition to the stated key Fibo. level near $22.95, bearish MACD signals and sustained trading below the one-week-old descending trend line, as well as the 50-DMA, adds strength to the downside bias.
That said, further weakness may find multiple speed-breakers around $22.80 and $22.20 before testing the $22.00 level comprising September 22 bottom.
It should be noted, however, that the metal’s weakness past $22.00 will make it vulnerable to refresh yearly low, around $21.40 at the latest.
Meanwhile, an upside break of the 61.8% Fibonacci retracement level of $22.95 will push the XAG/USD prices towards the stated short-term resistance line near $23.15.
However, any further upside past $23.15 will be challenged by 50% Fibo. and 50-DMA levels surrounding $23.40 and $23.60 in that order.
Silver: Daily chart
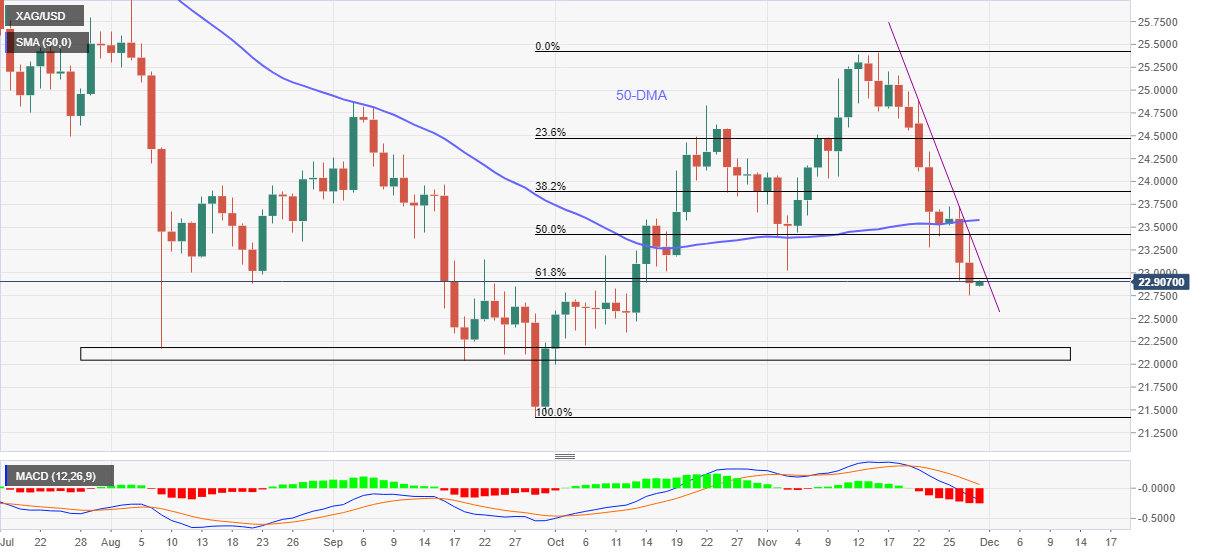
Trend: Bearish
Author

Anil Panchal
FXStreet
Anil Panchal has nearly 15 years of experience in tracking financial markets. With a keen interest in macroeconomics, Anil aptly tracks global news/updates and stays well-informed about the global financial moves and their implications.


