|

Silver Price Analysis: XAG/USD bears take breather near 61.8% Fibo. level around mid-$20.00s

  • Silver continues losing ground for the fourth straight day and refreshes the YTD low on Monday.
  • Oversold oscillators on the daily chart help the XAG/USD to find support near the 61.8% Fibo.
  • The setup still favours bearish traders and supports prospects for a further depreciating move.

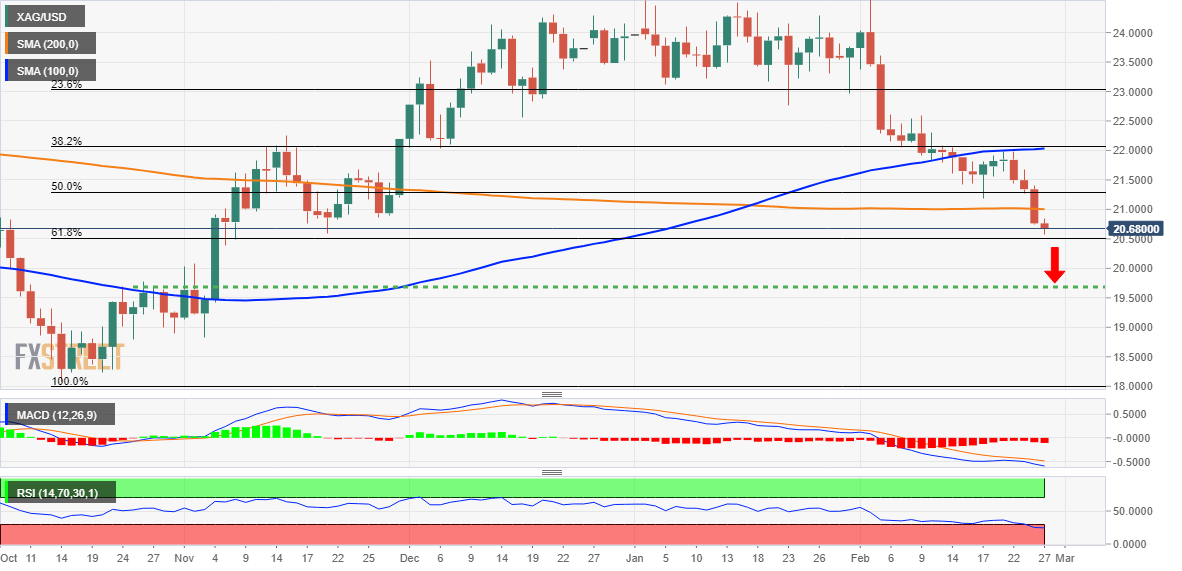
Silver remains under some selling pressure for the fourth successive day and drops to a fresh YTD low during the first half of trading on Monday. The white metal currently trades just above the mid-$20.00s and seems vulnerable to prolonging the recent downfall witnessed since the beginning of this month.

Friday's convincing break and acceptance below a technically significant 200-day Simple Moving Average (SMA) adds credence to the negative outlook. That said, oscillators on the daily chart are flashing extremely oversold conditions, making it prudent to wait for some consolidation or a modest rebound before positioning for further losses.

Any attempted recovery, however, is more likely to meet with a fresh supply near the $21.00 mark. This, in turn, should cap the XAG/USD near the $21.30-$21.35 region, marking the 50% Fibonacci retracement level of the rally from October 2022. The latter should act as a pivotal point, which if cleared could prompt some near-term short-covering.

Bearish traders, meanwhile, take a breather near the 61.8% Fibo. level, below which the XAG/USD could accelerate the fall towards challenging the $20.00 psychological mark. The white metal could eventually drop to the $19.75-$19.70 intermediate support en route to the $19.15 horizontal zone and the $19.00 round-figure mark.

Silver daily chart
fxsoriginal

Key levels to watch

XAG/USD

Overview
Today last price20.66
Today Daily Change-0.10
Today Daily Change %-0.48
Today daily open20.76
 
Trends
Daily SMA2022.2
Daily SMA5023.14
Daily SMA10022.02
Daily SMA20021.01
 
Levels
Previous Daily High21.4
Previous Daily Low20.74
Previous Weekly High21.98
Previous Weekly Low20.74
Previous Monthly High24.55
Previous Monthly Low22.76
Daily Fibonacci 38.2%20.99
Daily Fibonacci 61.8%21.15
Daily Pivot Point S120.53
Daily Pivot Point S220.31
Daily Pivot Point S319.87
Daily Pivot Point R121.2
Daily Pivot Point R221.63
Daily Pivot Point R321.86

Author

Haresh Menghani

Haresh Menghani is a detail-oriented professional with 10+ years of extensive experience in analysing the global financial markets.


More from Haresh Menghani
Share:

Editor's Picks

AUD/USD stabilizes above two-week low/0.6950 as traders await US election results

AUD/USD edges higher in the Asian session on Wednesday, recovering slightly from a two-week low touched on a less hawkish RBA reaction the previous day. Hopes for Iran diplomacy undermine the safe-haven US Dollar and support the currency pair, though the upside remains capped as traders await US midterm election results.

USD/JPY retreats from three-week top, slips below 158.50 amid intervention risks and softer USD

USD/JPY slides below 158.50 in the Asian session on Wednesday, snapping a two-day winning streak to hit a near three-week high the previous day, as intervention risks support the Japanese Yen. Meanwhile, the US Dollar remains on the back foot amid hopes for Iran diplomacy, further weighing on the currency pair as traders brace for some volatility surrounding US midterm election results.


Gold consolidates below $3,950 as Fed hike bets counter softer USD ahead of US election results

Gold struggles to capitalize on the previous day's bounce from sub-$3,900 levels, oscillating in a range during the Asian session on Wednesday as traders brace for short-term market volatility surrounding US midterm election results. Meanwhile, hopes for Iran diplomacy weigh on the safe-haven US Dollar and support bullion, though upside remains capped amid Fed rate hike bets.

Ethereum: US-led selling keeps ETH below $2,309 realized price
Ethereum (ETH) faces pressure near $2,300 on Tuesday as it struggles to recover its realized price. The top altcoin fell below its realized price, or investors' average on-chain cost basis, at $2,309 following the $6.3 billion Binance hack last Thursday.
US Midterms: Can Wall Street rally despite AI debt and credit risks?
Political uncertainty may be coming to an end, but the real question for investors is whether the technology sector can sustain its enormous spending commitments. The US midterm elections are arriving at an interesting moment for financial markets.
The 2% inflation target came from a throwaway remark. It now moves trillions
The Federal Reserve's 2% inflation goal grew out of an off-the-cuff remark by a New Zealand politician in 1988. Bond investors still price long-term US debt as if 2% holds, so a change in how the Fed measures inflation would move markets.